


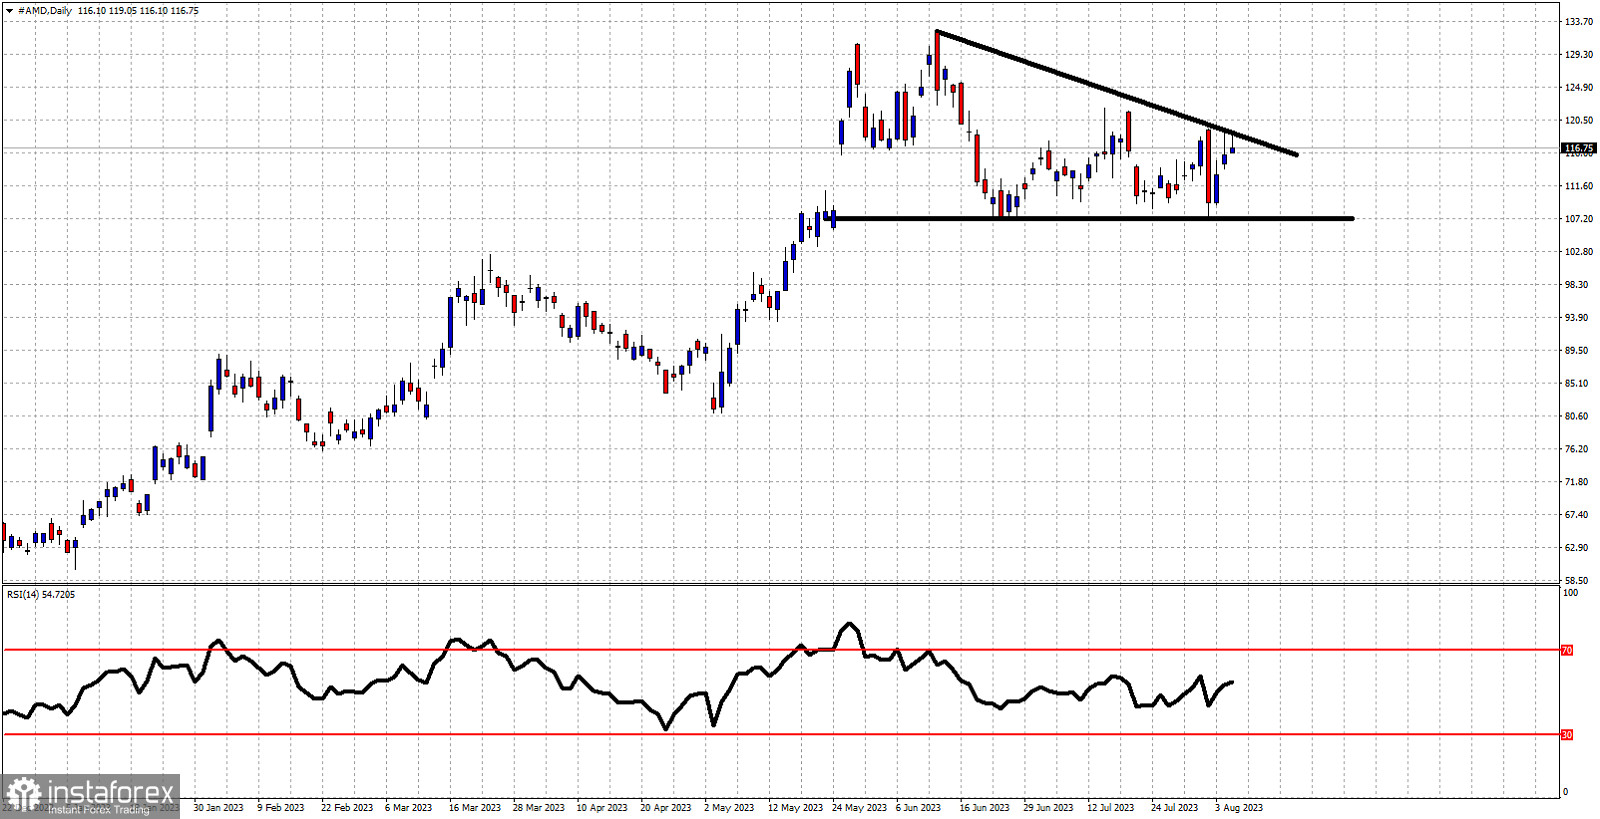
Black lines- triangle pattern
AMD stock price is trading around $117. Price is forming lower highs but the lows continue to respect the $107 level. Price has formed a descending triangle pattern. Price is now challenging the upper triangle boundary. AMD stock price has resistance at $118.80 and support at $107. There is still room for sideways movement inside the triangle pattern until the end of the month. If however price breaks below $107 we should expect more selling pressures to push price towards $90. If resistance at $118.80 is broken, we should at least expect a challenge of the highs at $132. With price just below the resistance of $118.80, at current levels we prefer to be bearish because chances of a rejection are high. We remain bearish as long as price is below $118.80.


