


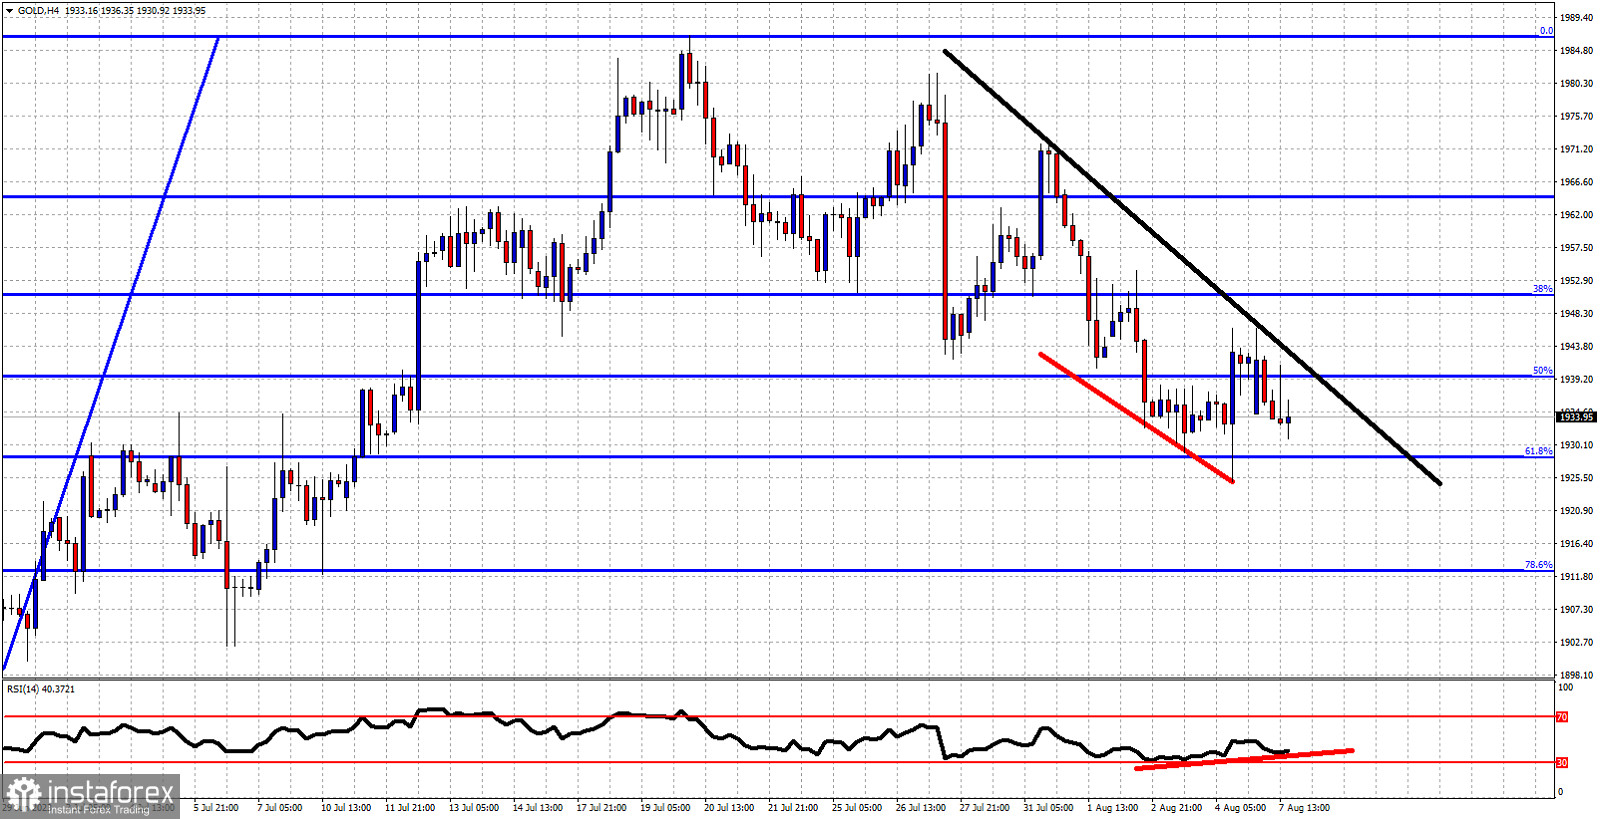
Red lines-bullish RSI divergence
Black line- resistance
Blue lines- Fibonacci retracement levels
Gold price is trading around $1,934. Short-term trend remains bearish as price continues making lower lows and lower highs. Price has reached the 61.8% Fibonacci retracement of the last upward move. Gold also remains below the black downward sloping resistance trend line. The RSI is making higher lows providing bullish divergence signs. However this is not a reversal signal but only a warning for a weakening down trend. Bulls need to push price above the black resistance trend line and above the recent high of $1,946. As long as price is below this level, we expect Gold price to continue lower towards the 78.6% retracement at $1,912.


