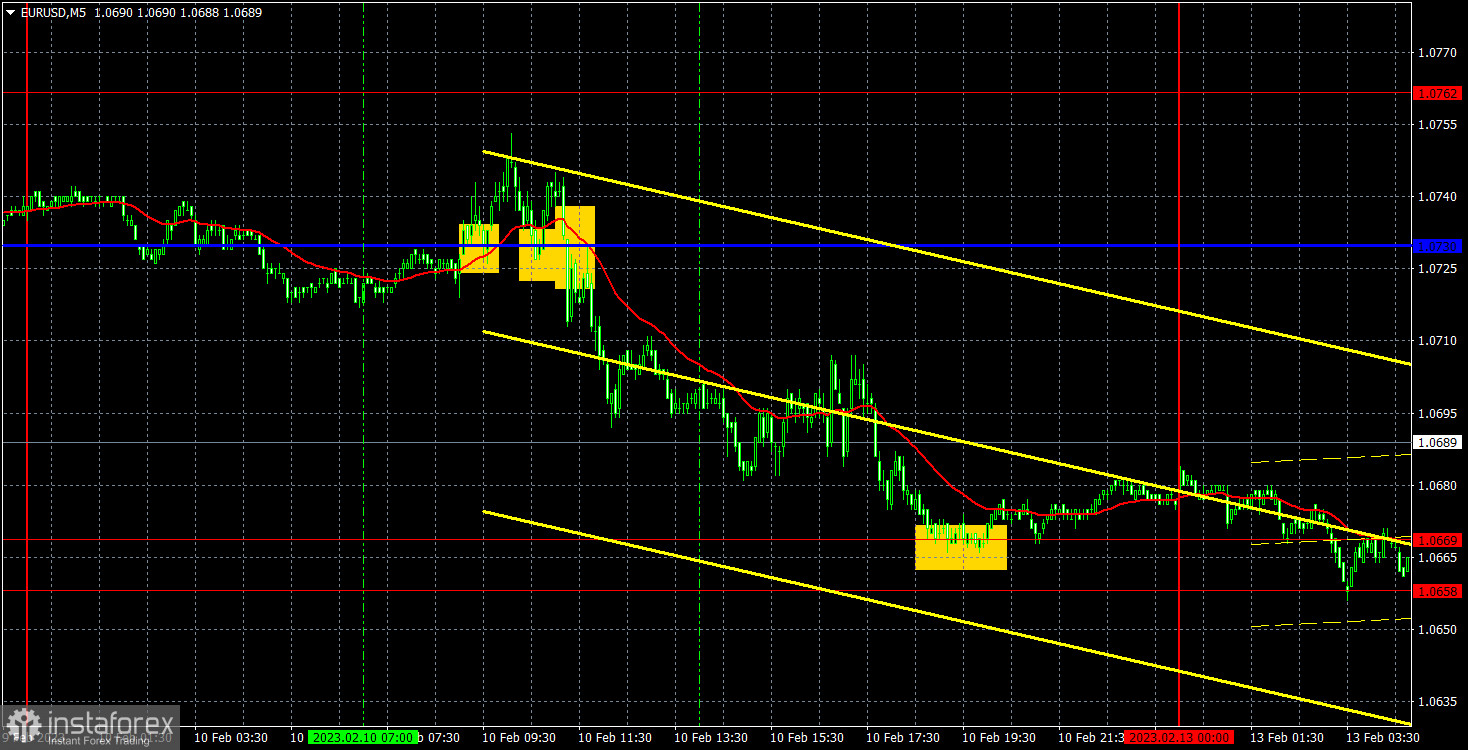
M5 chart of EUR/USD

On Friday, EUR/USD continued to fall and by the end of the day it was near its local lows. It failed to start a bullish correction and there's a high probability that the euro will continue to fall in the medium term. The pair remains too overbought, and the growth it's shown in recent months seemed unreasonable. Traders have already worked off all the bullish factors on the euro, and a correction has been brewing for more than a month. I believe that all factors are now in favor of the continuation of the quotes' decline. No fundamental and macroeconomic background on Friday. The only thing that stood out was the Consumer Sentiment Index from the University of Michigan, which was slightly above forecasts, but it did not have a strong impact on the pair's movement. The movements were purely technical.
And not the best ones at that. At the European trading session, the pair showed several sharp reversals, and also crossed the critical line several times. Thus, false signals began to form immediately. Several of them were formed near the Kijun-Sen line. First of all, there were two buy signals, and they both failed to reach the nearest target level of 1.0762. Then there was a sell signal, which made it possible for traders to earn good profit, because by the end of the day, the pair was near the target level of 1.0669, if not for the two false buy signals before it. So, some traders could open a short position, but it was against the rules of the trading system. In general, the day didn't turn out quite great.
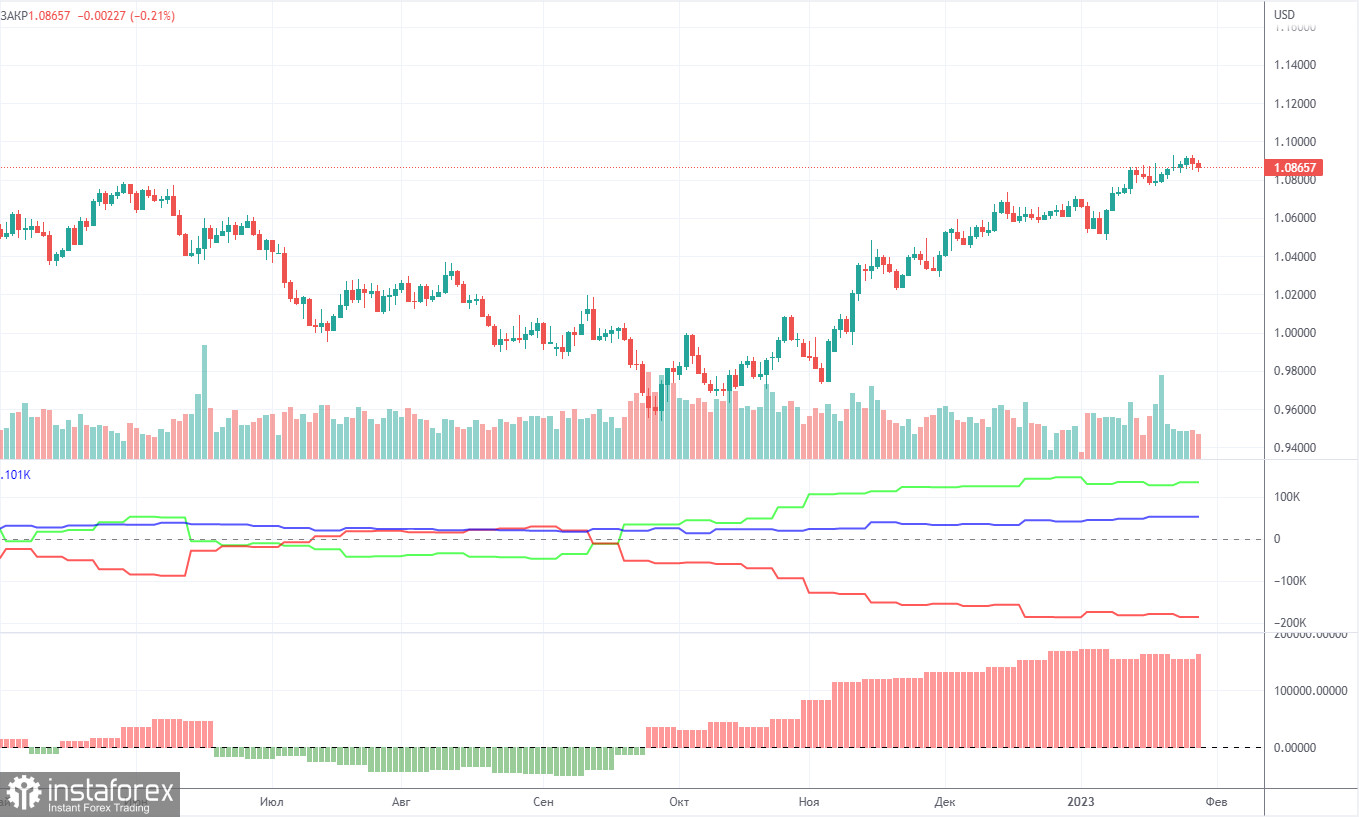
COT report

The COT reports on EUR/USD have been in line with expectations in recent months. The net non-commercial position has been on the rise since early September. The euro started to rise around the same time. The bullish non-commercial position rises with each new week. Taking into account this fact, we may assume that the uptrend will soon come to an end. The red and green lines of the first indicator are far apart, which is usually a sign of the end of a trend. In the reporting week, non-commercial traders opened 9,500 long positions and 2,000 short ones. The net non-commercial position grew by 7,500. The number of long positions exceeds that of short ones by 134,000. There were no new COT reports in the last two weeks, and it's difficult to explain the cause exactly. So now we have to work with the data we have at our disposal. The correction was formed for a long time anyway, so it's clear even without the reports that the pair should continue falling.
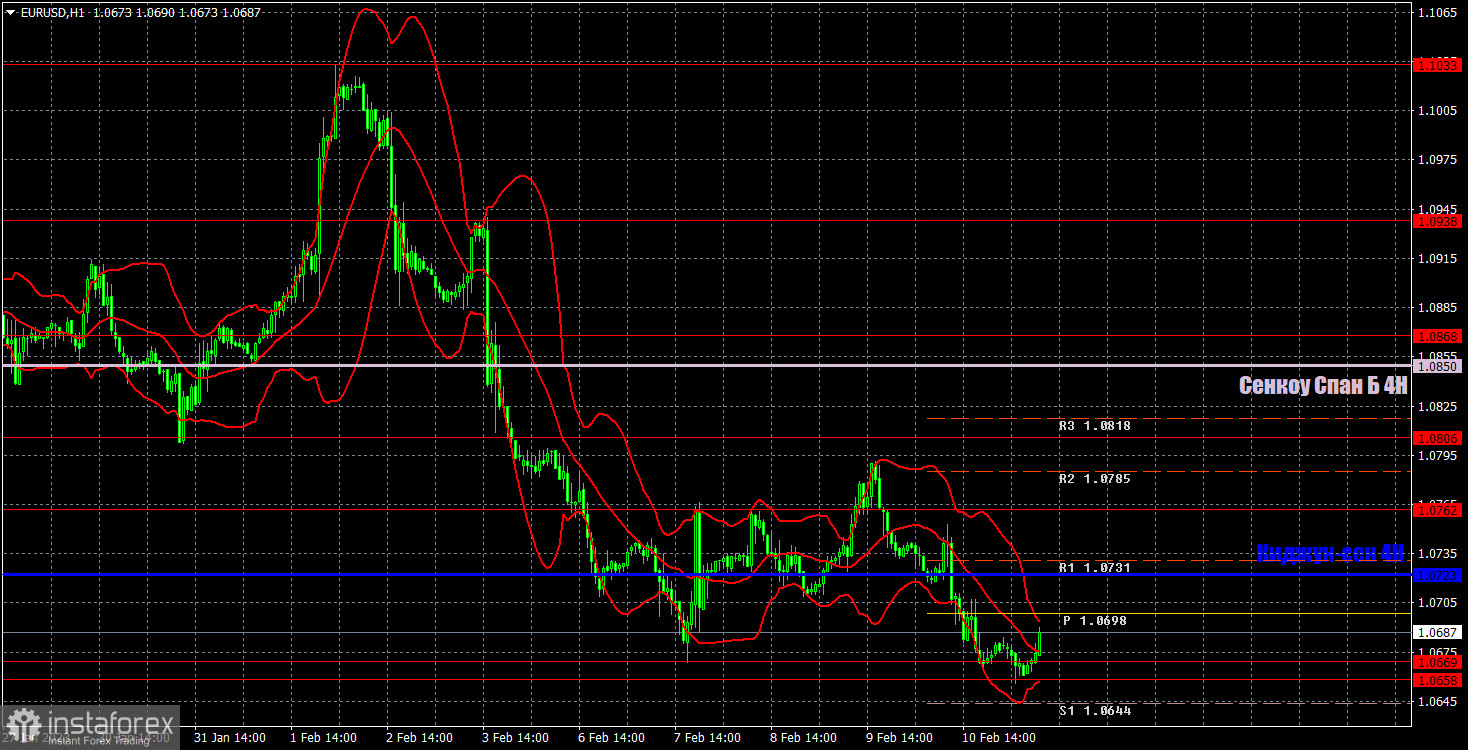
H1 chart of EUR/USD

On the one-hour chart, EUR/USD is still bearish. The quotes are currently located below the critical line, so the pair will likely fall. In order to fall further, the pair should overcome the 1.0658-1.0669 area. Fundamental and macroeconomic backgrounds are not the priority for now, since the price went up for a long time, often ignoring them. Now it is time for it to fall. On Monday, important levels are seen at: 1.0485, 1.0581, 1.0658-1.0669, 1.0762, 1.0806, 1.0868, 1.0938, as well as the Senkou Span B (1.0850) and Kijun Sen (1.0723) lines. Lines of the Ichimoku indicator may move during the day, which should be taken into account when determining trading signals. There are also support and resistance levels, but signals are not formed near these levels. Bounces and breakouts of the extreme levels and lines could act as signals. Don't forget about stop-loss orders, if the price covers 15 pips in the right direction. This will prevent you from losses in case of a false signal. No important events in the EU and the US on February 13. So traders will have nothing to react to. The movements may not be attractive or volatile.
What we see on the trading charts:
Price levels of support and resistance are thick red lines, near which the movement may end. They do not provide trading signals.
The Kijun-sen and Senkou Span B lines are the lines of the Ichimoku indicator, moved to the one-hour chart from the 4-hour one. They are strong lines.
Extreme levels are thin red lines from which the price bounced earlier. They provide trading signals.
Yellow lines are trend lines, trend channels, and any other technical patterns.
Indicator 1 on the COT charts reflects the net position size of each category of traders.
Indicator 2 on the COT charts reflects the net position size for the non-commercial group.


