


M5 chart of GBP/USD
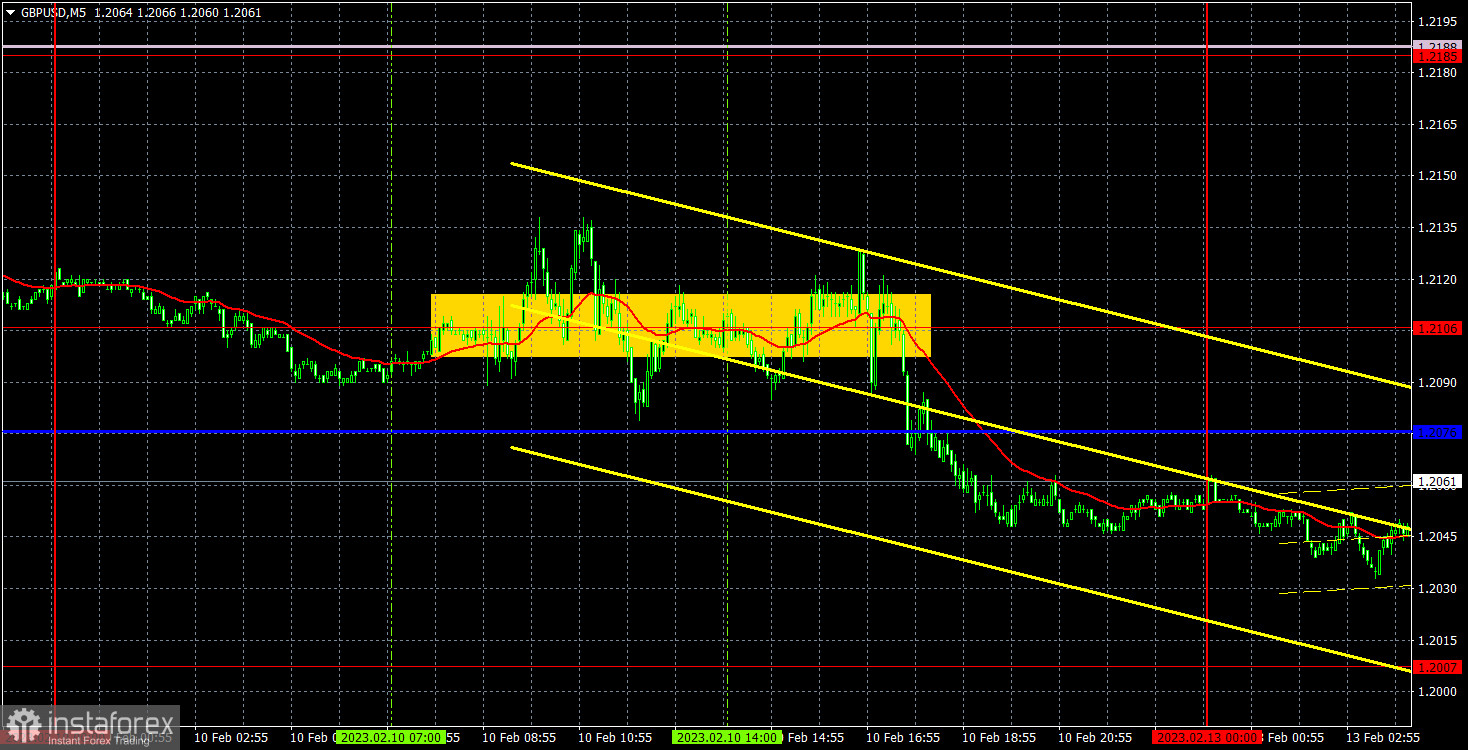
On Friday, GBP/USD was flat for most of the day. The movements were sharp with frequent reversals, so it was quite inconvenient to trade. The macroeconomic background was strong, but the market did not come to a consensus about how they should process it, and what to do in general. The UK GDP rose 0% in the fourth quarter, which was fully in line with forecasts. However, it is estimated to have fallen by a revised 0.3% in the third quarter. In general, we can consider this report as negative, and the pound fell by the end of the day, so technically it all makes sense. Anyway, I expect the British currency to fall further, as it was rising too long and too much for it to resume its uptrend now. The price is located below the Ichimoku indicator lines, so there are no technical reasons to expect an upward movement now. There will be more important macro data this week, but you should focus on technique.
It doesn't even make sense to highlight Friday's trading signals. The price crossed 1.2106 ten times, at the same time, it managed to reach the critical line. Thus, traders could take long positions using the first two signals. In one case, the pair went up the necessary 20 points, in the second case, it didn't. Therefore, one position was closed by Stop Loss at Breakeven, the second one at a loss. In general, the rest of the trading signals should not have been considered.
COT report
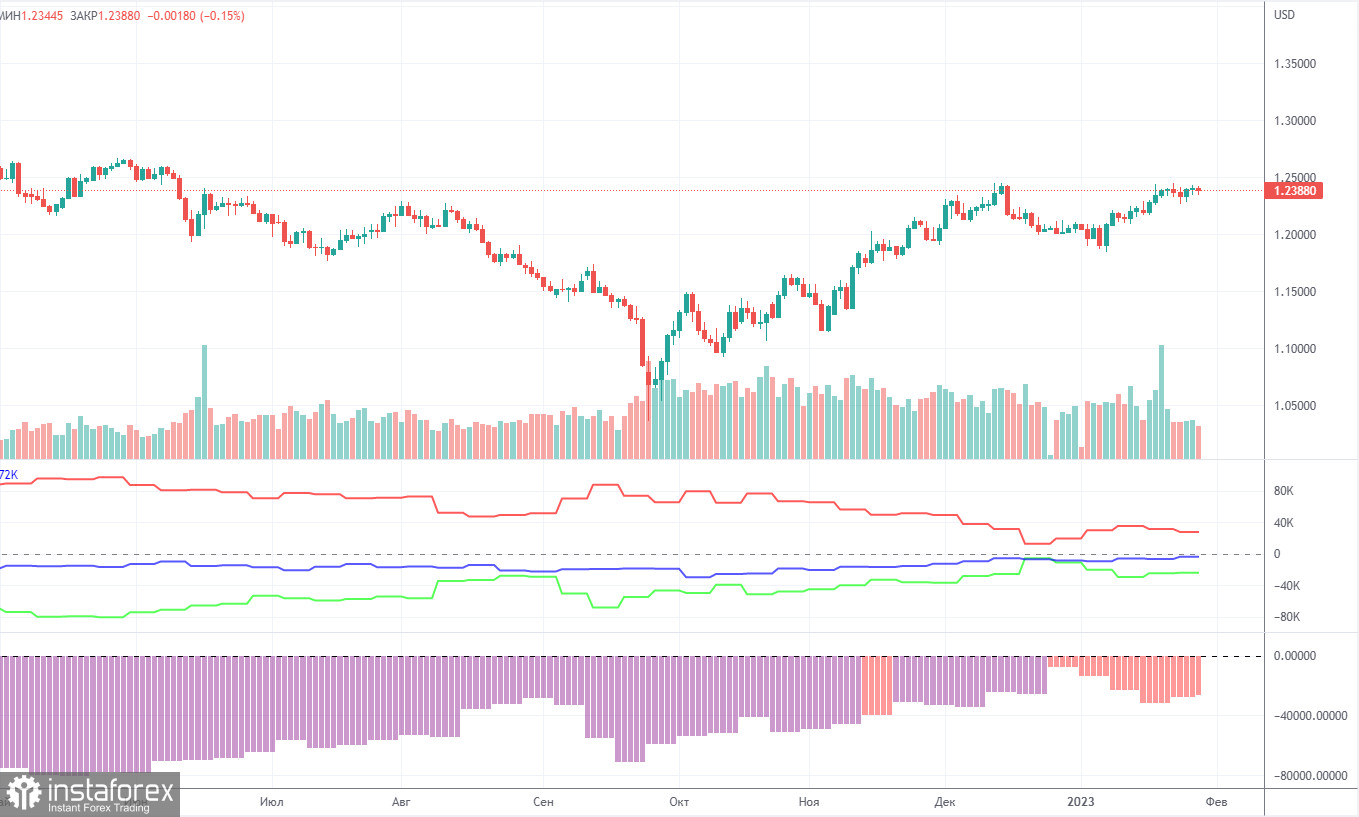
The recent COT report on the pound sterling unveiled that the bearish sentiment became weaker. During the week, non-commercial traders closed 6,700 long positions and 7,500 short ones. Thus, the net position of non-commercial traders increased by 800. And with the net position steadily increasing in the past months, the mood of market players is likely to become bullish in the near future. However, even though the pound has been rising against the dollar in recent months, it is very difficult to pinpoint the exact reason. There is also a chance that it will fall in the future as the currency needs a correction. On the whole, the COT reports are in line with the movement of the pound in recent months. Since the net position is not bullish yet, traders may buy the asset in the next few months. For now, non-commercial traders have 35,000 longs and 59,000 shorts. It is important to note though that it is uncertain whether the pound will have a long-lasting growth. Although it has technical reasons for that, the fundamental and geopolitical factors do not presuppose a strong and fast increase.
H1 chart of GBP/USD
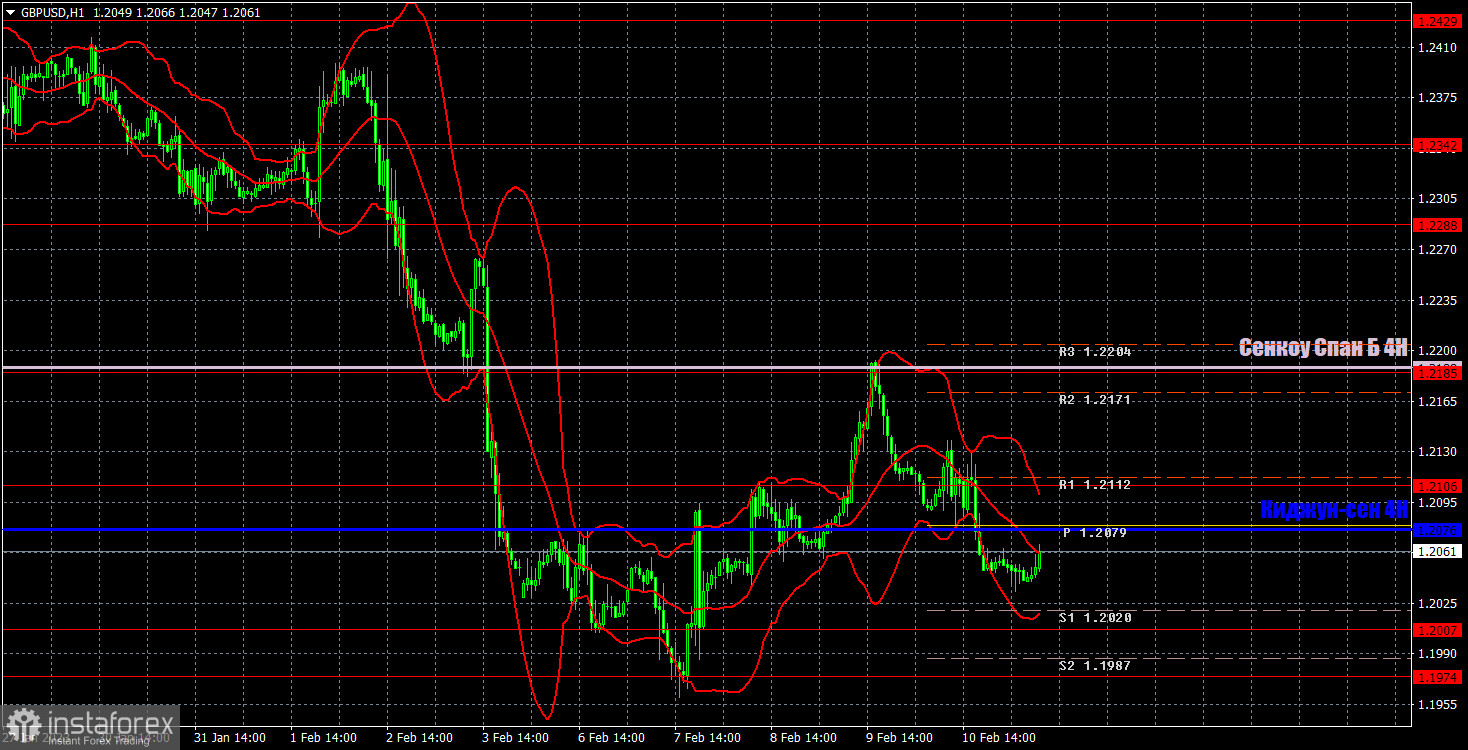
On the one-hour chart, GBP ended the bullish correction and is ready to move to 1.1974, where the last local low is located. I believe that the pound will continue to fall regardless of any data and "fundamentals", but this week there will be important reports and events, so they may also have a certain impact on the pair's movement. On Monday, important levels are seen at: 1.1760, 1.1874, 1.1974-1.2007, 1.2106, 1.2185, 1.2288, 1.2342. The Senkou Span B (1.2188) and Kijun Sen (1.2076) lines can also be sources of signals. Pullbacks and breakouts through these lines may produce signals as well. A Stop Loss order should be set at the breakeven point after the price passes 20 pips in the right direction. Ichimoku indicator lines may move during the day, which should be taken into account when determining trading signals. In addition, the chart does illustrate support and resistance levels, which could be used to lock in profits. There are no important events or reports planned for in the UK and the US. Therefore, we might see weak movement and reduced volatility.
What we see on the trading charts:
Price levels of support and resistance are thick red lines, near which the movement may end. They do not provide trading signals.
The Kijun-sen and Senkou Span B lines are the lines of the Ichimoku indicator, moved to the one-hour chart from the 4-hour one. They are strong lines.
Extreme levels are thin red lines from which the price bounced earlier. They provide trading signals.
Yellow lines are trend lines, trend channels, and any other technical patterns.
Indicator 1 on the COT charts reflects the net position size of each category of traders.
Indicator 2 on the COT charts reflects the net position size for the non-commercial group.


