


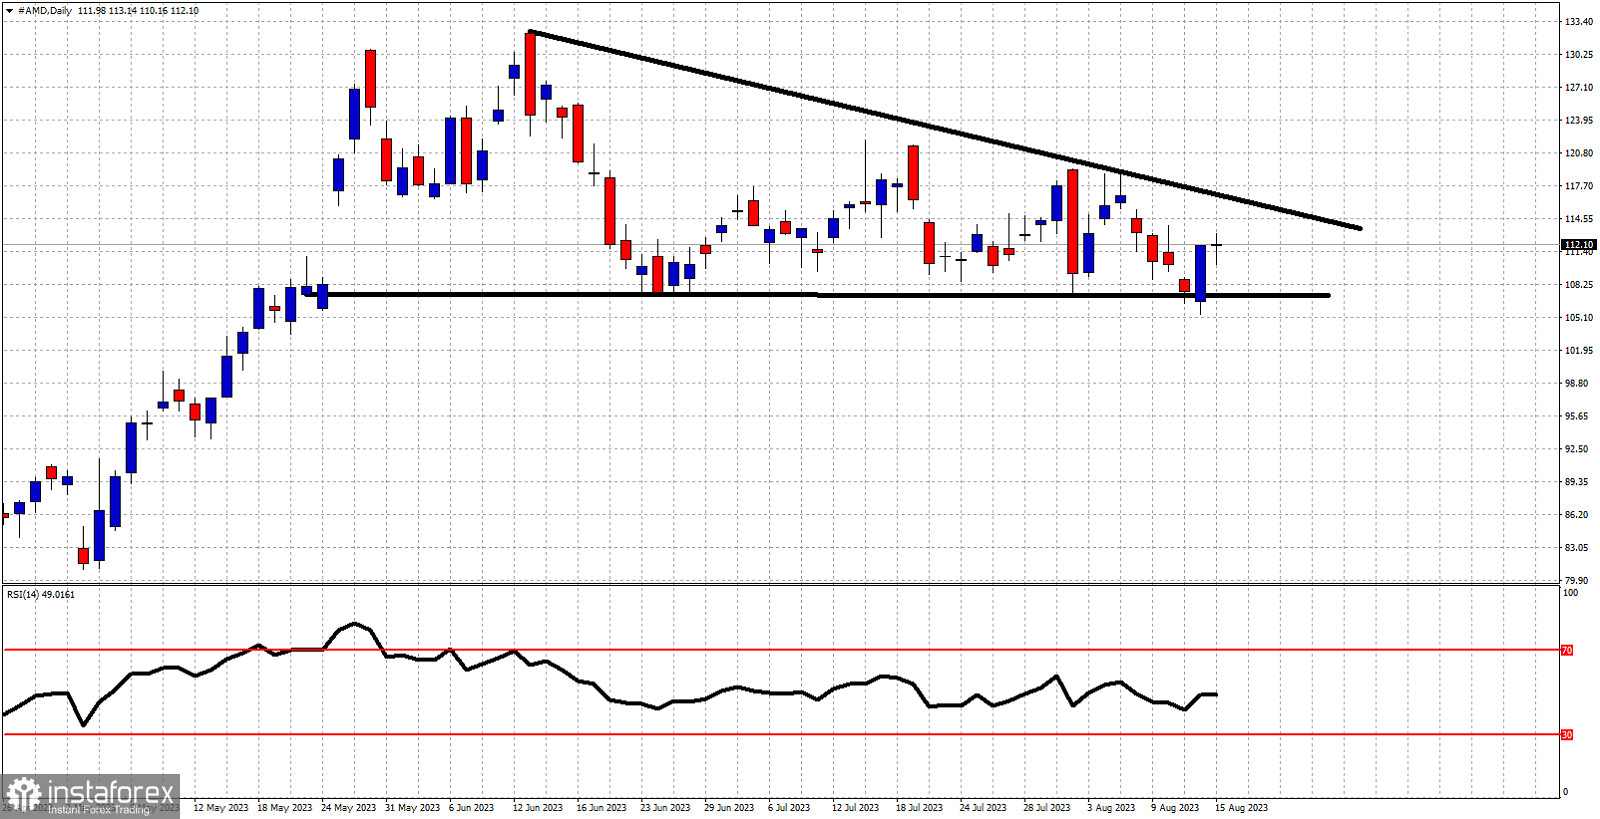
Black lines- descending triangle pattern
AMD stock price continues to trade sideways inside the descending triangle pattern. Price recently got rejected at the upper triangle boundary and as expected moved lower towards the lower boundary of the pattern around $107. Support at $107 has been respected and price is now bouncing off this support level. Resistance is found at $116.35. Support remains key at $107. There is still room for price to continue to trade inside the triangle pattern. Traders need to remain patient.


