


Overview :
Bearish outlook:
The pair trades above all its moving averages (100) and (50), with the shorter one gaining upward traction just below the 50 Simple Moving Average (SMA). The EUR/USD paoir traded higher and closed the day in the red zone near the area of 1.0882 - 1.0971. Today it was trading in a narrow range of 1.0882 - 1.0971, staying close to a 8-week high.
On the hourly chart, the EUR/USD pair is still trading above the moving average line MA (100) H1 (1.0882). The situation is similar on the one-hour chart. Based on the foregoing, it is probably worth sticking to the north direction in trading, and as long as the EUR/USD pair remains above MA 100H1, it may be necessary to look for entry points to buy at the end of the correction.
The 100 SMA, in the meantime, extended its advance, currently standing at around 1.0882. Finally, technical indicators remain well into positive territory, with uneven directional strength, although far from suggesting bullish exhaustion. The EUR/USD pair bounced from an intraday low of 1.0882, achieved after the data from the US showed that Housing Starts rose sharply in June.
The US Dollar also gather strength against its rivals on the back of growth-related concerns. Probably, the main scenario is continued growth towards 1.0971 as soon as possible. The alternative scenario is consolidation below MA100 H1, followed by a fall to 1.0882. The EUR/USD pair is staying in consolidation from 1.0920 and intraday bias remains neutral.
Further rally is expected as long as 1.0882 support holds. On the upside, above 1.0882 will resume the rise from 1.0882 to retest 1.0971 high. Decisive break there will confirm resumption of whole up trend from 1.0971. In the near term, and according to the one-hour chart, the risk skews to the downside.
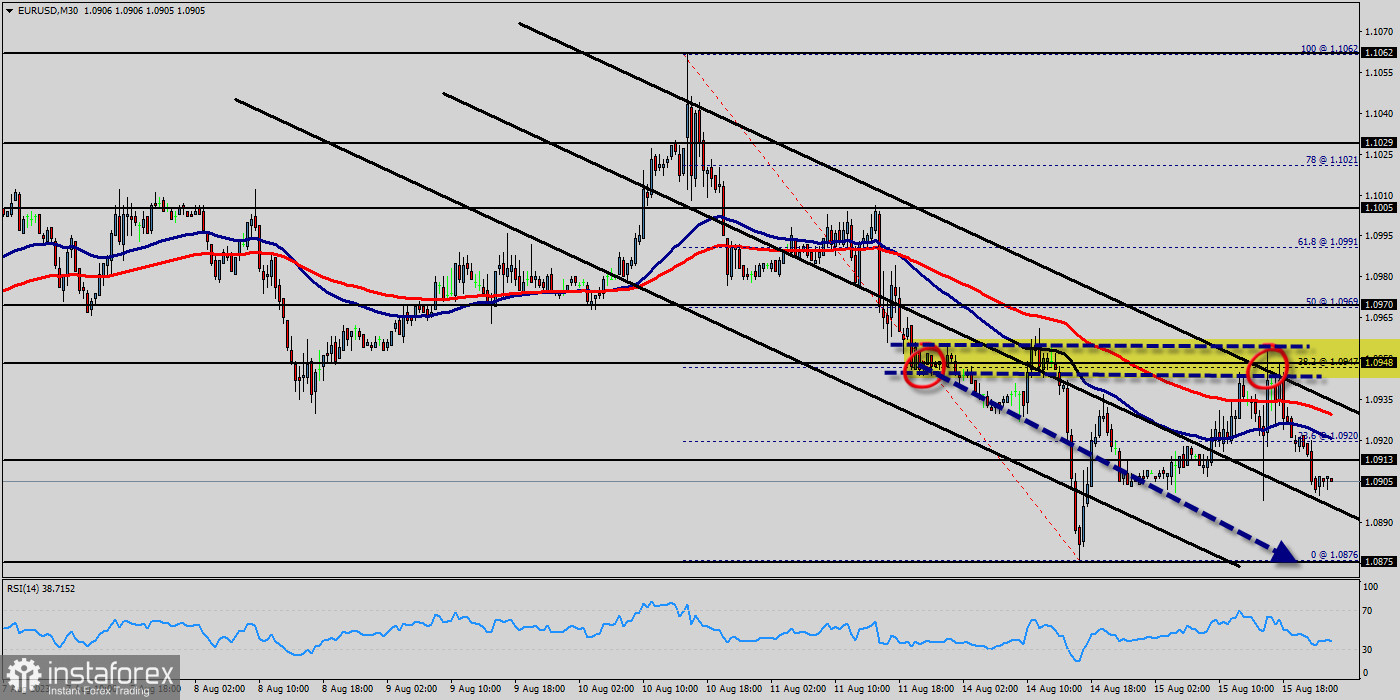
The EUR/USD pair develops below a still bullish 50 SMA, while the longer ones remain far below the current level. The Momentum indicator heads firmly south within negative levels, while the Relative Strength Index (RSI) indicator also heads lower but is currently at around 35, somehow indicating reluctant selling interest. However, firm break of 1.0882 will extend the corrective pattern from 1.0826 with another falling leg, targeting 1.0794 and below.
If the pair fails to pass through the level of 1.0991, the market will indicate a bearish opportunity below the strong resistance level of 1.0991. In this regard, sell deals are recommended lower than the 1.0991 level with the first target at 1.0908. It is possible that the pair will turn downwards continuing the development of the bearish trend to the level 1.0858.
However, stop loss has always been in consideration thus it will be useful to set it above the last double top at the level of 1.1041 (notice that the major resistance today has set at 1.1041). The daily chart for the EUR/USD pair shows it posted modest losses for a third consecutive day, yet the downside remains well-limited.


