


Trend analysis (Fig. 1).
The pound-dollar pair may move upward from the level of 1.2037 (closing of Friday's daily candle) to 1.2090, the 50.0% pullback level (yellow dotted line). Upon reaching this level, a continued upward movement is possible with the target of 1.2132, the 61.8% pullback level (yellow dotted line).
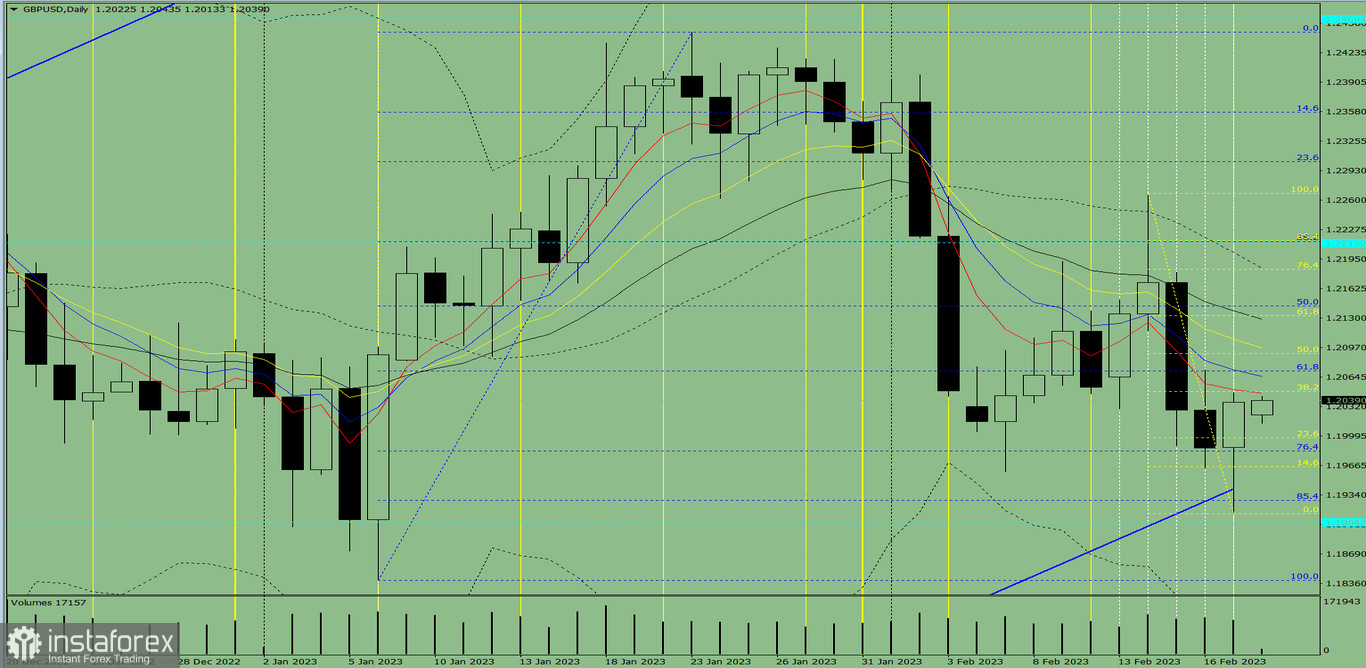
Fig. 1 (daily chart).
Comprehensive analysis:
- Indicator analysis - up;
- Fibonacci levels - up;
- Volumes - up;
- Candlestick analysis - up;
- Trend analysis - up;
- Bollinger bands - down;
- Weekly chart - up.
General conclusion:
Today, the price may move upward from the level of 1.2037 (closing of Friday's daily candle) to 1.2090, the 50.0% pullback level (yellow dotted line). Upon reaching this level, a continued upward movement is possible with the target of 1.2132, the 61.8% pullback level (yellow dotted line).
Alternatively, the price may move upward from the level of 1.2037 (closing of Friday's daily candle) to 1.2071, the 61.8% pullback level (blue dotted line). When testing this level, the price may move down.


