


Trend analysis
EUR/USD may continue its upward movement this week, from the level of 1.0693 (closing of the last weekly candle) to the historical resistance level at 1.087 (blue dotted line). After this price is reached, the pair will climb further up.
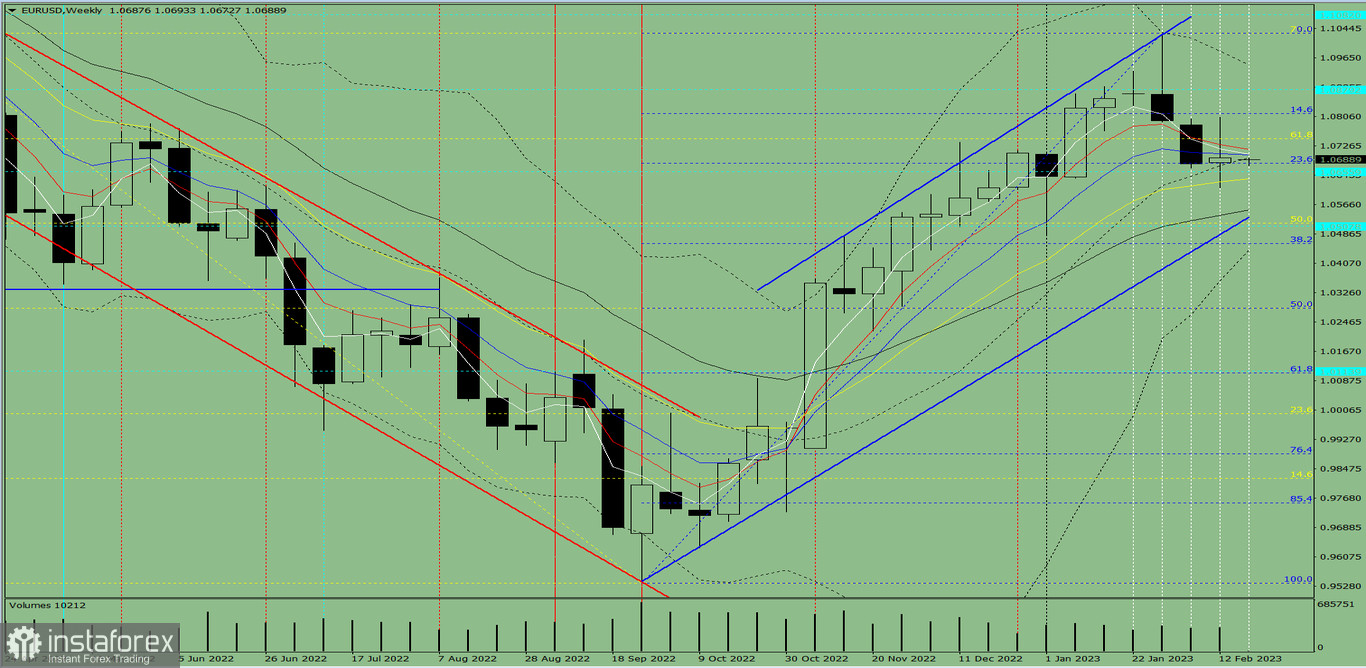
Fig. 1 (weekly chart)
Comprehensive analysis:
Indicator analysis - uptrend
Fibonacci levels - uptrend
Volumes - uptrend
Candlestick analysis - uptrend
Trend analysis - uptrend
Bollinger bands - uptrend
Monthly chart - uptrend
All these point to an upward movement in EUR/USD.
Conclusion: The pair will have a bullish trend, with no first lower shadow on the weekly white candle (Monday - up) and a second upper shadow (Friday - down).
So during the week, euro will rise from 1.0693 (closing of the last weekly candle) to the historical resistance level at 1.087 (blue dotted line), then climb further up.
Alternatively, the quote may jump from 1.0693 (closing of the last weekly candle) to the 61.8% retracement level at 1.0745 (yellow dotted line), and then resume a downward movement.


