


If you want to trade long positions on EUR/USD, you will need:
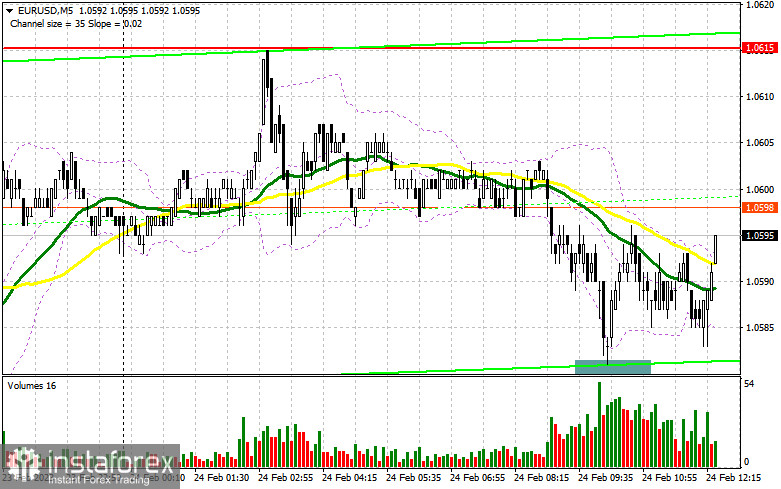
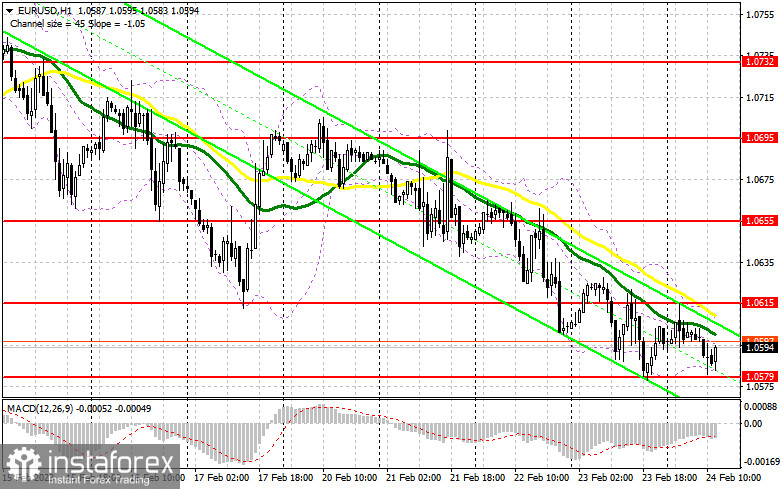
We are anticipating several statistics that could put pressure on the euro once more during the American session, particularly if the index of personal consumption expenditures rises and changes are made to the level of household spending. The volume of homes sold in the main US market will also be crucial, and the US dollar will once again be in demand if strong indicators emerge. The "cherry on top" of today will be Loretta Mester's speech, an FOMC member. As a result, if the euro continues to weaken, I will target the pair at the morning support of 1.0579, as it was during the European session. When a false collapse occurs there, I purchase to recover to the resistance of 1.0615, just below where the moving averages on the bears' side pass. In light of the weak US statistics and the deteriorating housing market condition, the breakout and top-down test of 1.0615 create an extra entry point for developing long positions with a move to 1.0655. When 1.0655 is broken, the stop orders for the bears will be hit, shifting the market and maybe bringing it to 1.0695, where I will fix profits. The possibility of a decrease in the EUR/USD pair as well as the lack of buyers at 1.0579 in the afternoon will keep the pair under pressure. It should be noted that buyers have already tested this level twice. The bearish trend will be strengthened by its breakout. In this instance, the following support of 1.0533 will be highlighted. The only indication to buy the euro will be the development of a false breakout there. For a rebound from the low of 1.0487, or even lower - around 1.0451 - I will begin long positions right away with the target of an upward corrective of 30-35 points during the day.
You need the following to open short positions on EUR/USD:
The week's minimum was attempted to be updated by euro sellers, who took advantage of the poor statistics and tried everything to do so. This could result in the closing of short positions on Friday, which would cause the euro to surge significantly upward despite positive US economic data. So be careful: if a strong downward movement does not follow the release of fundamental reports, the formation of a false breakout in the resistance area of 1.0615, just below where the moving averages are located, favoring sellers, will be the best scenario for opening short positions under the current circumstances. In this instance, a weekly minimum sales target of 1.0579 will continue to be the target. The market will become more bearish as a result of the collapse and reversal test of this range, which is another signal to start short positions with an exit around 1.0533. A more significant drop to the level of 1.0487, where I will take profit, will result from fixing below this range. Given how the bulls acted last Friday, I encourage you to delay opening short positions until the level of 1.0655 if the EUR/USD rises during the American session and there are no bears at 1.0615. Moreover, you can only sell there following a failed consolidation. With a target of a 30-35 point downward correction, I will open short positions right now for a rebound from the maximum of 1.0695.
Due to a CFTC technical issue that has persisted for more than two weeks. The most recent COT reports have not yet been released. The data only covers January 24 after that.
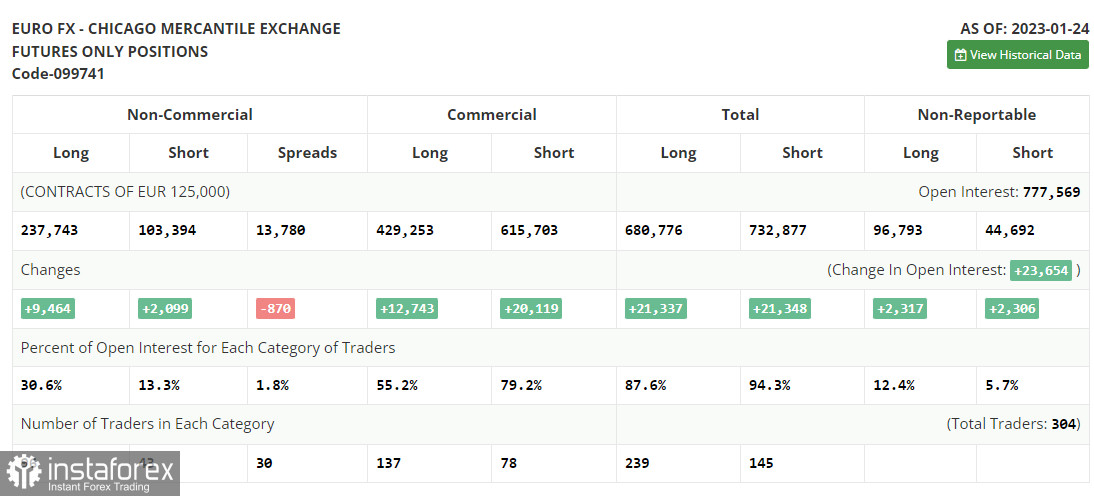
Both long and short positions increased as of January 24 according to the COT report (Commitment of Traders). The ECB representatives' speeches from last week had an impact on traders, who actively increased their long positions in anticipation of the ECB continuing its aggressive policy and the Federal Reserve System adopting a less aggressive stance that may, for the second time in a row, reduce the amount by which the rate will be raised. Recent weak fundamental indicators on the US economy, particularly the decline in retail sales and the easing of inflationary pressure, indicate that it is time to loosen up since the Fed's continued tight monetary policy could worsen the situation. This week's schedule of central bank meetings will determine the pair's future course. According to the COT data, the number of long non-profit positions rose by 9,464 to 237,743, while the number of short non-profit positions increased by 2,099 to 103,394. The total non-commercial net position rose to 134,349 from 126,984 towards the conclusion of the week. All of this shows that investors are confident in the euro's future growth but are awaiting more information on interest rates from central banks. In contrast to 1.0833, the weekly ending price increased to 1.0919.
Signals from indicators
Moveable Averages
Trade is taking place below the 30 and 50-day moving averages, indicating the sellers' advantage.
Notably, the author considers the time and prices of moving averages on the hourly chart H1 and departs from the standard definition of the traditional daily moving averages on the daily chart D1.
Bands by Bollinger
The indicator's upper limit, which is located around 1.0615, will serve as resistance in the event of growth.
Description of indicators
- Moving average (moving average determines the current trend by smoothing out volatility and noise). Period 50. The graph is marked in yellow.
- Moving average (moving average determines the current trend by smoothing out volatility and noise). Period 30. The graph is marked in green.
- MACD indicator (Moving Average Convergence / Divergence - moving average convergence/divergence) Fast EMA period 12. Slow EMA period 26. SMA period 9
- Bollinger Bands (Bollinger Bands). Period 20
- Non-profit speculative traders, such as individual traders, hedge funds, and large institutions use the futures market for speculative purposes and to meet certain requirements.
- Long non-commercial positions represent the total long open position of non-commercial traders.
- Short non-commercial positions represent the total short open position of non-commercial traders.
- Total non-commercial net position is the difference between the short and long positions of non-commercial traders.


