


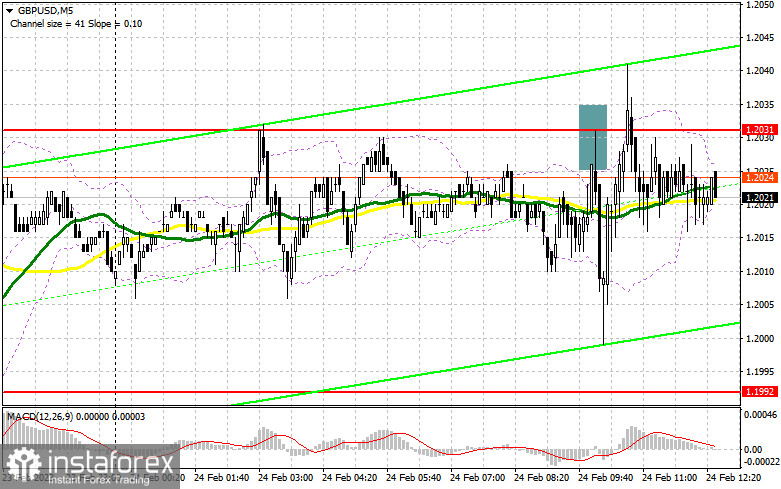
I focused on the level of 1.2031 when I made my morning forecast and suggested trading decisions based on it. Let's analyze the 5-minute chart to see what happened. A false collapse developed and grew, which provided a strong signal to sell the pound. The first downward movement was roughly 25 points, and the pair is still under pressure. The technical situation was left unchanged for the remainder of the day.
You require the following to open long positions on the GBP/USD:
We can anticipate another surge of the pound down to 1.1992 as everyone waits for statistics on the United States, which may once again surprise many. We can anticipate developing a positive correction by the end of the week if the data on the index of personal consumption expenditures, changes in the level of household spending, and the report on the volume of housing sales in the primary market disappoint traders. Nonetheless, the current situation still favors purchases with a decrease in the vicinity of the nearest support of 1.1992, which was created by yesterday's outcomes. If there is a false breakout in the afternoon, you will be able to buy with the possibility of a return to 1.2031. I will only wager on the continuation of the movement of the GBP/USD up to the maximum of 1.2070 after fixing and testing this range from top to bottom following the US data. Although it is unlikely that an exit would occur above this range today, it will open up growth prospects around 1.2109, where I have set profits. The bears will fully take over the market if the bulls are unable to fulfill their tasks and miss 1.1992, which is also possible following the speech of Federal Reserve System members. In this situation, I suggest against making hasty purchases and only start long positions around the next support level of 1.1954, and then only in the event of a false breakout. I'll buy GBP/USD right away only if it rises over the monthly low of 1.1919 with the intention of a correction of 30-35 points during the day.
For opening short positions on the GBP/USD, you will need:
Sellers completed the tasks assigned for the morning session and defended their resistance of 1.2031. Yet, far more significantly, there was no sustained pressure on the pound following that, which makes us doubt the pair's recent downward trend despite the positive US figures. Generally speaking, you must wait for the reports before making any new judgments. In the current position, it is recommended to sell again only after the next development of a false breakout in the area of 1.2031, as indicated above. This will serve as a signal to enter the market with the expectation of a decrease near the significant support level of 1.1992, where purchasers of the pound engaged in aggressive trading yesterday. The buyers' plans will be derailed by a breakthrough and a reversal test of this region, which will reinforce the presence of key market participants and constitute a sell signal with a decline below 1.1954. The 1.1919 area will be my farthest target, and that's where I'll set the profit. Bulls will continue actively entering the market as long as there is the possibility of GBP/USD growth and no bears around 1.2031 in the afternoon. In this scenario, the bears will pull back once more, and an entry point into short positions will only come from a false breakout at the next resistance level of 1.2070. In the absence of action, I will sell GBP/USD from the high of 1.2109, but only if the pair falls by 30-35 points within the day.
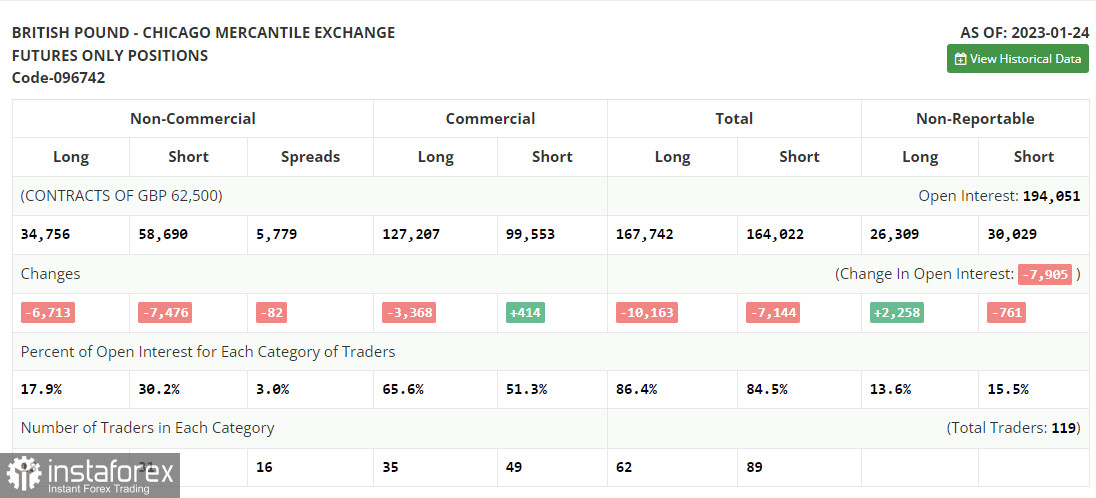
Due to a CFTC technical issue that has persisted for more than two weeks. The most recent COT reports have not yet been released. The data only covers January 24 after that.
Both long and short holdings were dramatically reduced in the COT report (Commitment of Traders) for January 24. But, given the difficulties the UK government is now facing, including dealing with strikes and demands for wage increases while also attempting to achieve a continuous fall in inflation, the recent reduction was within the acceptable threshold. However, for the time being, all of this is relegated to the background as we wait for the Federal Reserve System meetings, with its anticipated less aggressive policy, and the Bank of England meetings, with its certainty to maintain an aggressive tone of statements and raise the rate by another 0.5%. All of this will benefit the British pound, therefore I'll wager on it strengthening even more, unless, of course, something extraordinary occurs. According to the most recent COT data, short non-commercial positions declined by 7,476 to 58,690, while long non-commercial positions decreased by 6,713 to 34,756. As a result, the non-commercial net position's negative value decreased to -23,934 from -24,697 the previous week. We will continue to keep a careful eye on the economic indicators for the UK and the decision made by the Bank of England because such insignificant changes do not significantly alter the balance of power. In contrast to 1.2290, the weekly ending price increased to 1.2350.
Signals from indicators
Moving Averages
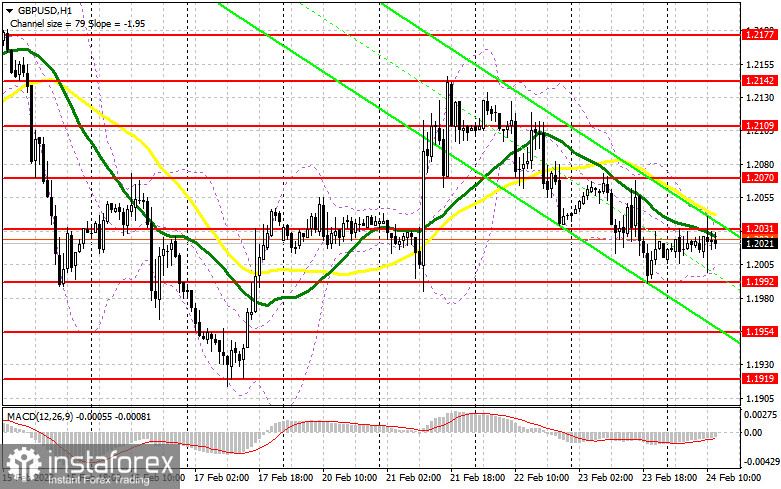
Trade is taking place below the 30 and 50-day moving averages, which suggests that the pair will continue to fall.
Notably, the author considers the time and prices of moving averages on the hourly chart H1 and departs from the standard definition of the traditional daily moving averages on the daily chart D1.
Bands by Bollinger
The indicator's upper bound, which is located at 1.2031, will serve as resistance in the event of growth.
Description of indicators
- Moving average (moving average determines the current trend by smoothing out volatility and noise). Period 50. The graph is marked in yellow.
- Moving average (moving average determines the current trend by smoothing out volatility and noise). Period 30. The graph is marked in green.
- MACD indicator (Moving Average Convergence / Divergence - moving average convergence/divergence) Fast EMA period 12. Slow EMA period 26. SMA period 9
- Bollinger Bands (Bollinger Bands). Period 20
- Non-profit speculative traders, such as individual traders, hedge funds, and large institutions use the futures market for speculative purposes and to meet certain requirements.
- Long non-commercial positions represent the total long open position of non-commercial traders.
- Short non-commercial positions represent the total short open position of non-commercial traders.
- Total non-commercial net position is the difference between the short and long positions of non-commercial traders.


