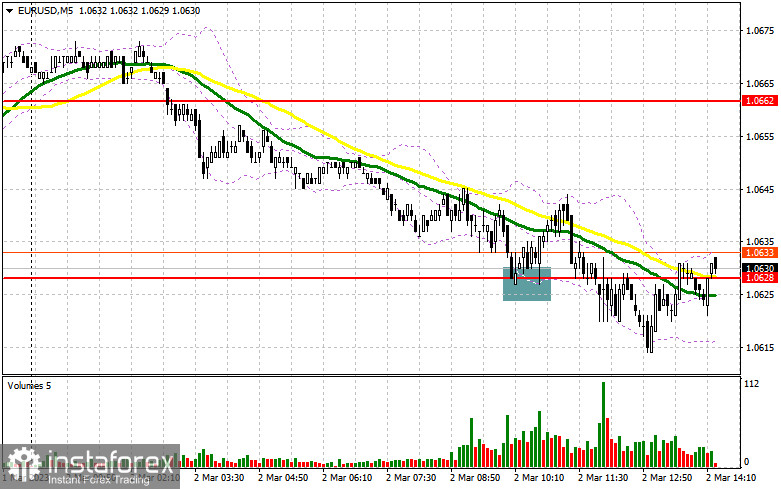
I focused on the level of 1.0628 when I made my morning forecast and suggested trading actions based on it. Let's take a look at the 5-minute chart and see what happened. The collapse and formation of a false breakout at this level resulted in a buy signal farther along the upward trend, but the pressure on the pair resumed following a 15-point surge. The technical picture was changed in the afternoon.

If you want to trade long positions on EUR/USD, you will need:
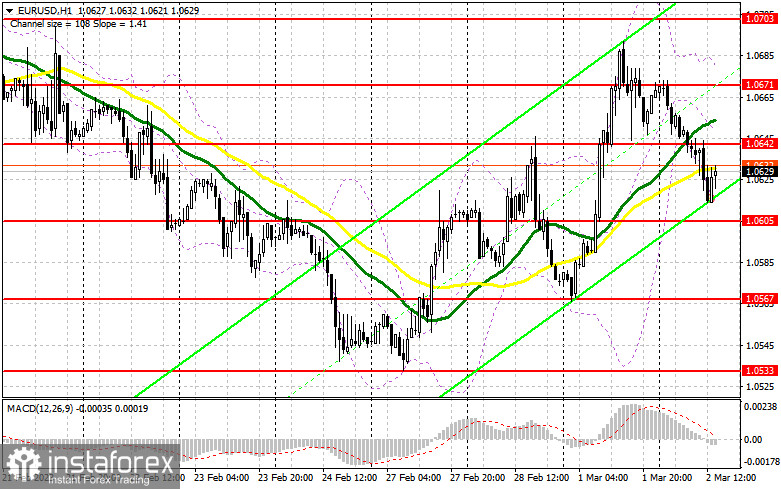
With yesterday's news, it was understandable for buyers of the euro to dismiss the information that inflation in the eurozone decreased less than economists had predicted. The European Central Bank's tough policy, which is now required, will harm the eurozone economy, thus fewer individuals are prepared to invest in riskier assets in the current conditions. Data on the number of initial unemployment benefit applications and adjustments to labor productivity in the US non-manufacturing sector are anticipated in the afternoon. The news is expected to cause the euro to collapse, therefore I won't enter long positions until after the fall and formation of a false breakout in the area of the new support 1.0605 created by yesterday's results. The resistance level of 1.0642, where the moving averages are favoring the bulls, will be the target of the rebound. With the US labor market data being weak, a breakout and top-down test of this area provide an extra entry point for accumulating long positions with a move to 1.0671. The bears' stop orders will be hit by the collapse of 1.0671, which will trigger an upward correction with a potential move to 1.0703, where I will fix profits. The pressure on the pair will increase if EUR/USD drops and there are no buyers above 1.0605 in the afternoon. In this instance, the following support of 1.0567 will be highlighted. Only the formation of a false collapse will give a buy signal for the euro. I'll start long positions right away in anticipation of a recovery from the 1.0533 low or even lower, around 1.0487, with the target of a 30- to 35-point upward corrective during the day.
You need the following to open short positions on EUR/USD:
Sellers of the euro must defend the nearest resistance level of 1.0642 since, by not allowing the pair to rise further, we can declare the end of the correction, which has failed to develop into a real trend. A failed attempt to go above 1.0642 in the afternoon following disappointing US economic data, along with the development of a false breakout at this level, will provide a great signal for sales in the 1.0605 area. There will undoubtedly be a heated battle for this level because if it is missed, the pressure on the EUR/USD will increase dramatically, and the bulls will give up on the idea of growth at the start of the next week. The market will become more negative as a result of the collapse and reversal test of this range, which is another indication to start short positions with an exit around 1.0567. Fixing below this level will result in a significant drop to the area of 1.0533, where I'll take a profit. If the EUR/USD moves higher during the US session and there are no bears around 1.0642, demand for the euro will rise. In this situation, I suggest delaying opening short positions until 1.0671. Moreover, you can only sell there following a failed consolidation. I will begin short positions immediately for a rebound from the high of 1.0703 with the target of a 30-35 point decline.


Signals from indicators
Moving Averages
Trade occurs in the area of the 30 and 50-day moving averages, which suggests market uncertainty.
Notably, the author considers the time and prices of moving averages on the hourly chart H1 and departs from the standard definition of the traditional daily moving averages on the daily chart D1.
Bands by Bollinger
The indicator's upper limit, which is located around 1.0680, will serve as resistance in the event of growth.
Description of indicators
- Moving average (moving average determines the current trend by smoothing out volatility and noise). Period 50. The graph is marked in yellow.
- Moving average (moving average determines the current trend by smoothing out volatility and noise). Period 30. The graph is marked in green.
- MACD indicator (Moving Average Convergence / Divergence - moving average convergence/divergence) Fast EMA period 12. Slow EMA period 26. SMA period 9
- Bollinger Bands (Bollinger Bands). Period 20
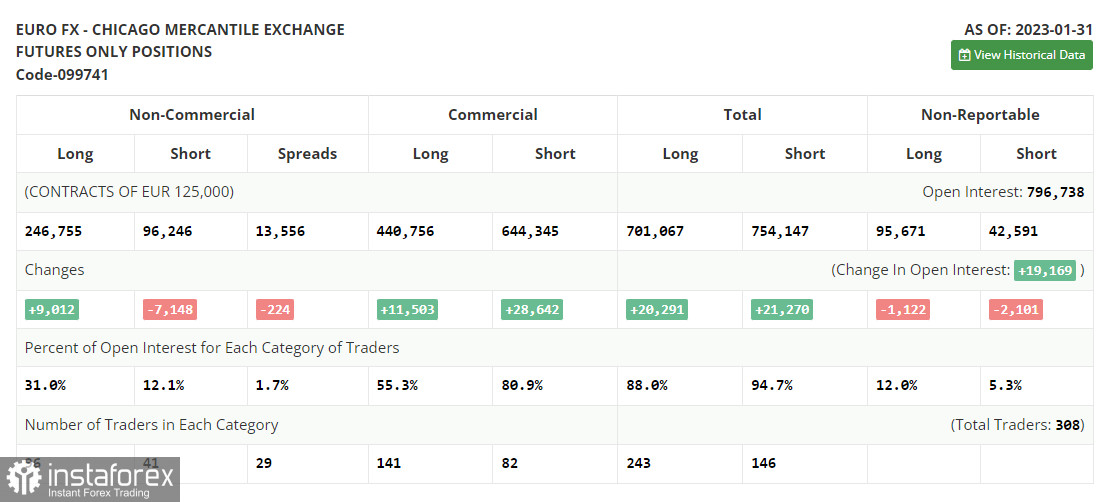
- Non-profit speculative traders, such as individual traders, hedge funds, and large institutions, use the futures market for speculative purposes and to meet certain requirements.
- Long non-commercial positions represent the total long open position of non-commercial traders.
- Short non-commercial positions represent the total short open position of non-commercial traders.
- Total non-commercial net position is the difference between the short and long positions of non-commercial traders.


