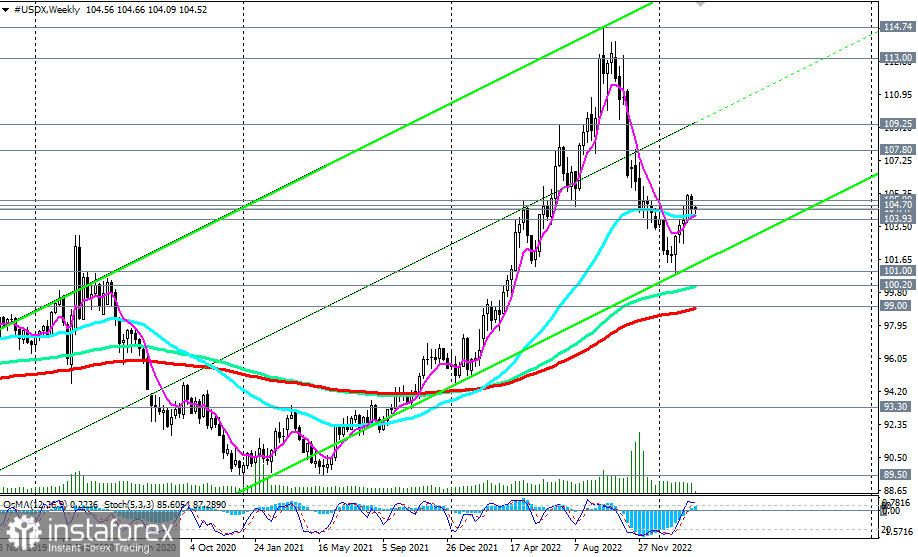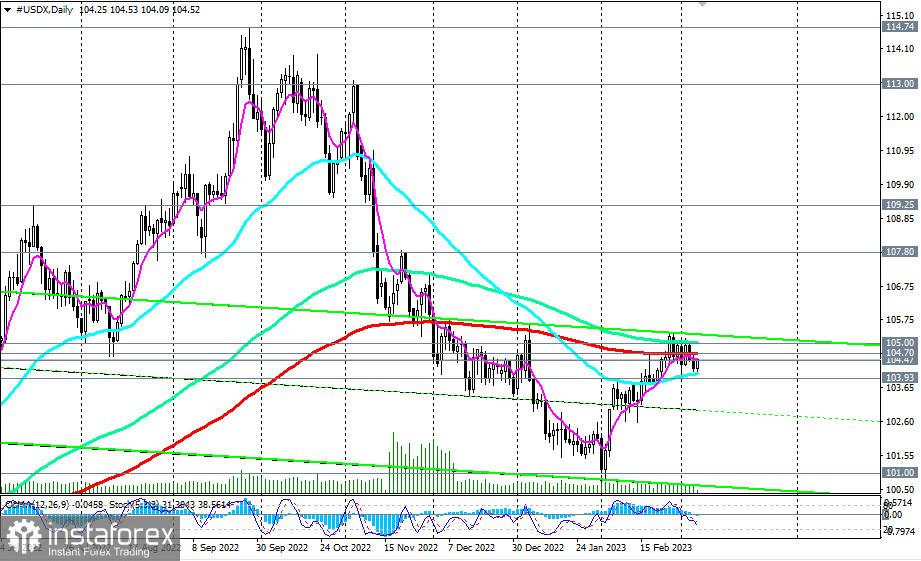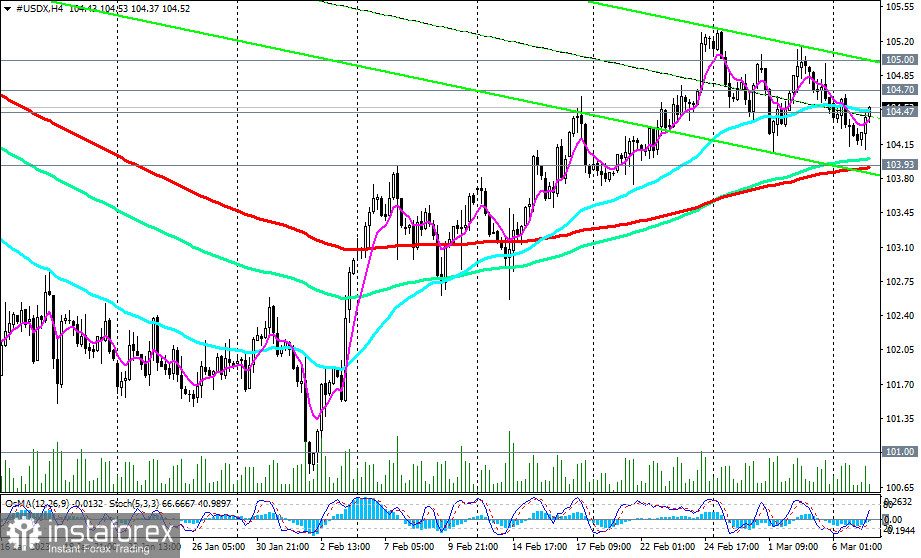
The U.S. Dollar Index futures have been trading in a fairly narrow range between 105.32 and 103.69 since the middle of last month. The upward correction in the dollar index, which started last month, has stalled near current levels. It is obvious that the dollar needs new news or fundamental drivers, either for growth or resumption of decline.

The signal for the resumption of long positions may be the breakdown of resistance levels 104.70 (200 EMA on the daily chart), 105.00 (144 EMA on the daily chart), 105.32 (local resistance level). Having fixed in the zone above these marks, the price may then continue its upward dynamics towards last year's highs near the marks of 113.00, 114.00, 114.70.
In an alternative scenario and after the breakdown of the 103.93 support level (200 EMA on the 4-hour chart), the price is likely to move towards the key support levels 100.20 (144 EMA on the weekly chart), 99.00 (200 EMA on the weekly chart).

The very first signal for the implementation of this scenario may be a breakdown of the short-term support level 104.47 (200 EMA on the 1-hour chart).
Support levels: 104.47, 104.00, 103.93, 103.69, 103.00, 102.00, 101.50, 101.00, 100.20, 99.00
Resistance levels: 104.70, 105.00, 105.32, 106.00, 107.00, 107.80, 109.25
Trading scenarios
Dollar Index CFD #USDX: Sell Stop 104.30. Stop Loss 104.80. Take-Profit 104.00, 103.93, 103.69, 103.00, 102.00, 101.50, 101.00, 100.20, 99.00
Buy Stop 104.80. Stop-Loss 104.30. Take-Profit 105.00, 105.32, 106.00, 107.00, 107.80, 109.25


