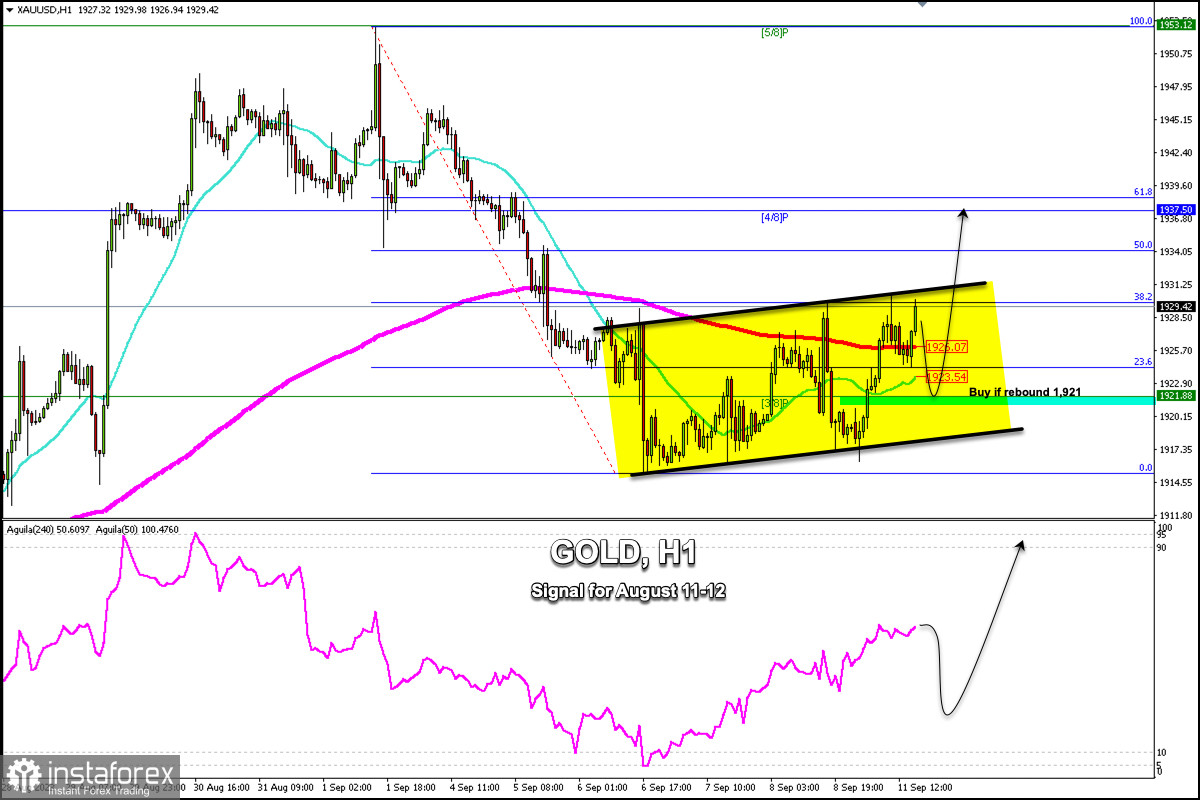
Early in the American session, gold is trading around 1,929.42, above the 21 SMA, and above the 200 EMA with an uptrend but showing signs of exhaustion. That's why it has been rejected four times by the strong resistance around 38.2% of Fibonacci (1,930).
The daily pivot point is located around 1921. It means that if gold consolidates above this level in the next few hours, the outlook could remain positive and we could expect gold to rise and reach 4/8 Murray located at 1,937 and it could even reach 61.8% Fibonacci around 1,940.
According to the H-1 chart, the eagle indicator is giving overbought signals. We expect if gold consolidates below 1,930, it could go through a technical correction and this could be seen as an opportunity to buy around 3/8 Murray (1,921).
On the other hand, in case gold falls and breaks below the bullish trend channel formed from the low of September 6 and consolidates below 1,917, then it could be seen as a signal to resume selling. Gold could reach the psychological level of $1,900 in the next few days.
Investors will be keeping an eye on August inflation data which will be released on Wednesday, September 13. It could serve as a turning point for gold. If the inflation data comes out higher than expected, it will be negative for the US dollar, so gold could suffer a sharp fall and it could reach the zone of $1,884.
On the contrary, if the data is positive for the US dollar, it is a clear signal that gold could surpass the area of 1,937 and could reach last week's high at 1,953 (5/8Murray). Finally, the price could rise to the 6/8 Murray zone at 1,967.
Our trading plan for the next few hours is to wait until a technical correction occurs and bounces around 3/8 Murray located at 1,921. We could buy with targets at 1,931 and 1,937


