EUR/USD

Larger timeframes
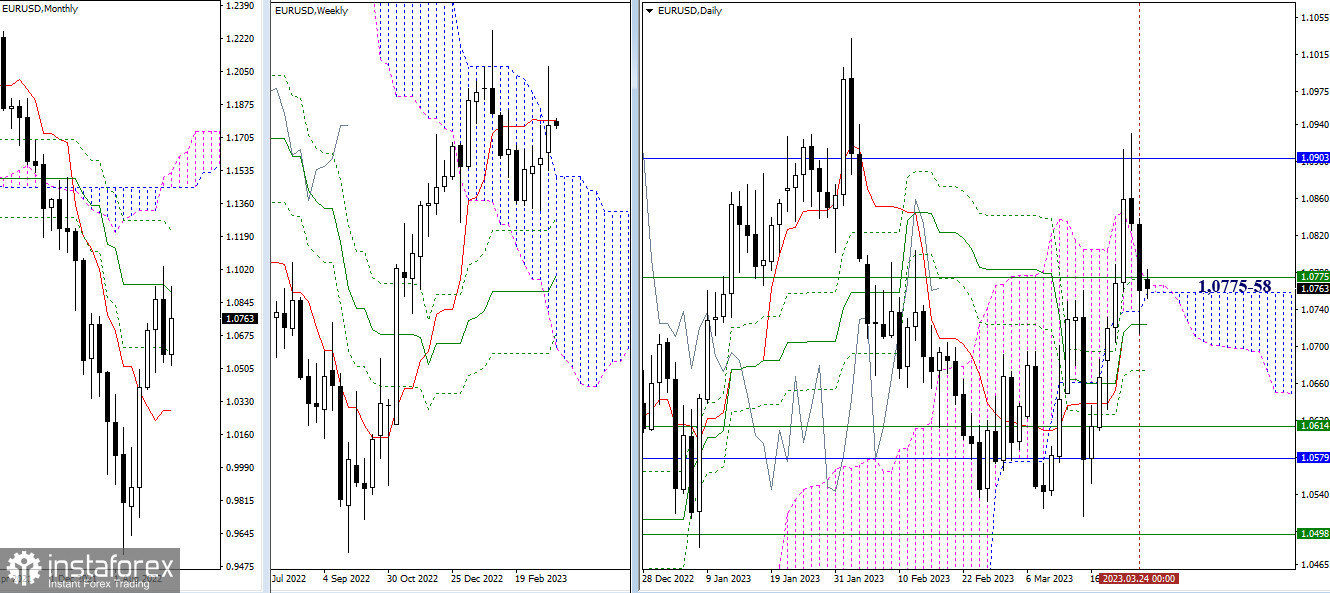
Last week, the euro bulls cast a long shadow into the bullish zone relative to an intraday and one-week Ichimoku clouds, having tested 1.09101, the resistance of a one-month medium-term trend. However, they failed to settle at the highs attained. The currency pair closed last trading week lower than the one-week short-term trend line of 1.0775 and returned to the daily cloud. As a result, the support zone is currently clustered between the daily cloud of 1.0758 and the one-week cloud of a short-term trend at 1.0775. Later today, if the bears don't try to terminate the daily Ichimoku cloud, they will have to settle below 1.0724-1.0675, the support area of the cross.

H4 – H1
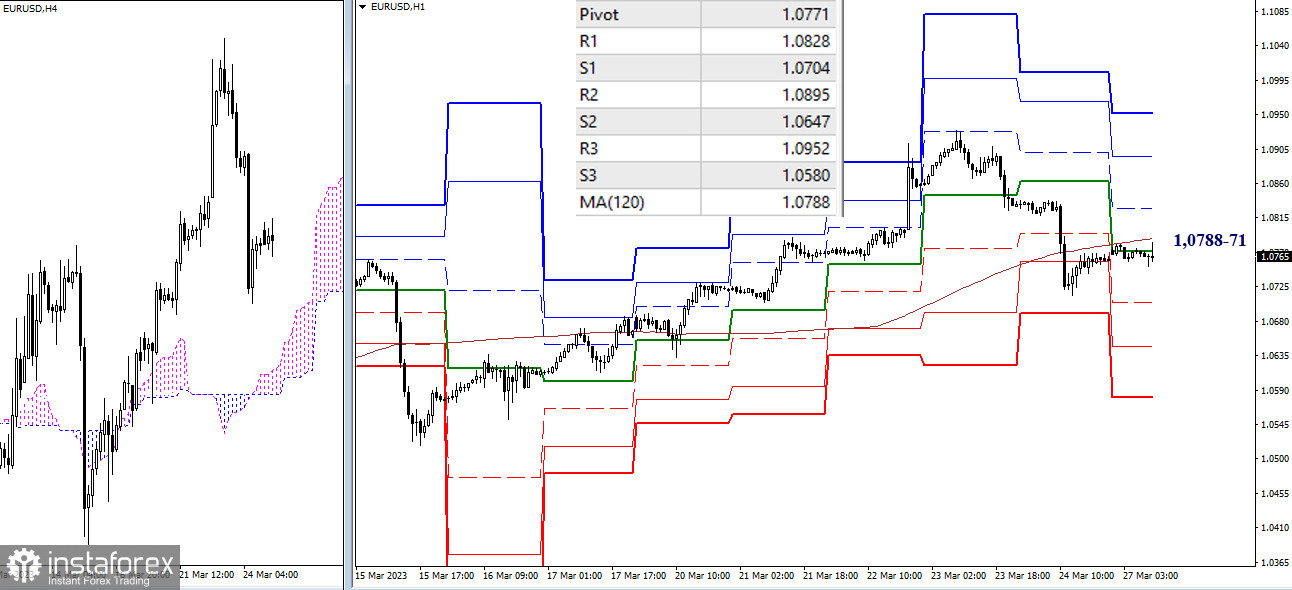
On smaller time frames, EUR/USD dipped below the critical levels so that the bears are regaining the upper hand in the market. Still, the bears lack the energy to leave the support area. If they manage to drag the price down, the support levels of classic pivot levels (1.0704 – 1.0647 – 1.0580) will serve as the downward intraday targets. If the bulls are able to seize the key level (the central pivot level of 1.0771 + the one-week long-term trend line of 1.0788), the ongoing balance of trading forces will shift in the bulls' favor. The bullish intraday targets could be set at 1.0828 – 1.0895 – 1.0952 which coincide with resistance levels of classic pivot levels.
***
GBP/USD

Larger timeframes
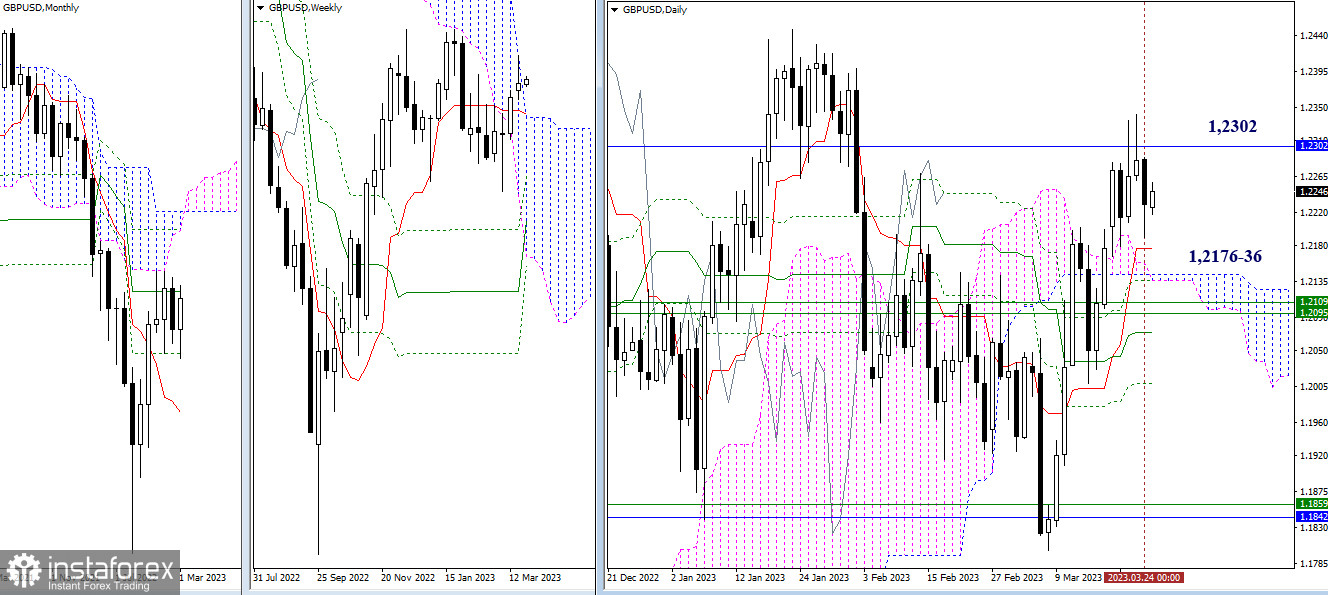
Last week, GBP/USD tested the one-month medium-term trend line at 1.2302. The price didn't break this level or at least, didn't close higher. Therefore, this level remains the basic resistance of this section. The next target for the bulls is seen at a higher level than a one-year high of 1.2447. The support zone is still wide and secured. It can be divided into three main areas: 1.2176 – 1.2136 (the daily cloud + levels of the daily cross), 1.2109 – 1.2095 – 1.2072 (one-week levels + daily medium-tern trend), and 1.2008 (the final level of the daily Ichimoku cross).

H4 – H1
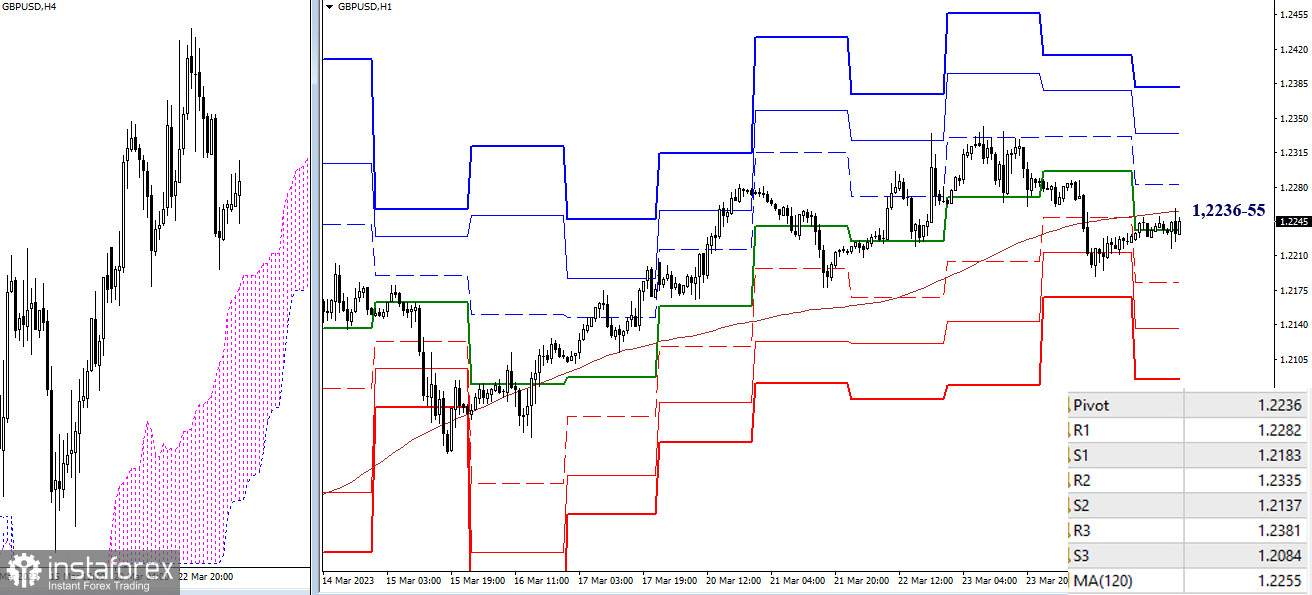
At the moment of analysis, the outlook for GBP/USD is uncertain. The instrument is connected to the zone of key levels which are combined today at 1.2236-55 (the central pivot level + one-week long-term trend line). Later on the trading day, the classic pivot levels will come into play because the bulls are interested in resistance levels of 1.2282 – 1.2335 – 1.2381, whereas the bears are interested in support levels of 1.2183 – 1.2137 – 1.2084.
***
This technical analysis is based on the following ideas:
Larger timeframes - Ichimoku Kinko Hyo (9.26.52) + Fibo Kijun levels
Smaller timeframes - H1 – classic pivot points + 120-period Moving Average (weekly long-term trend line)


