


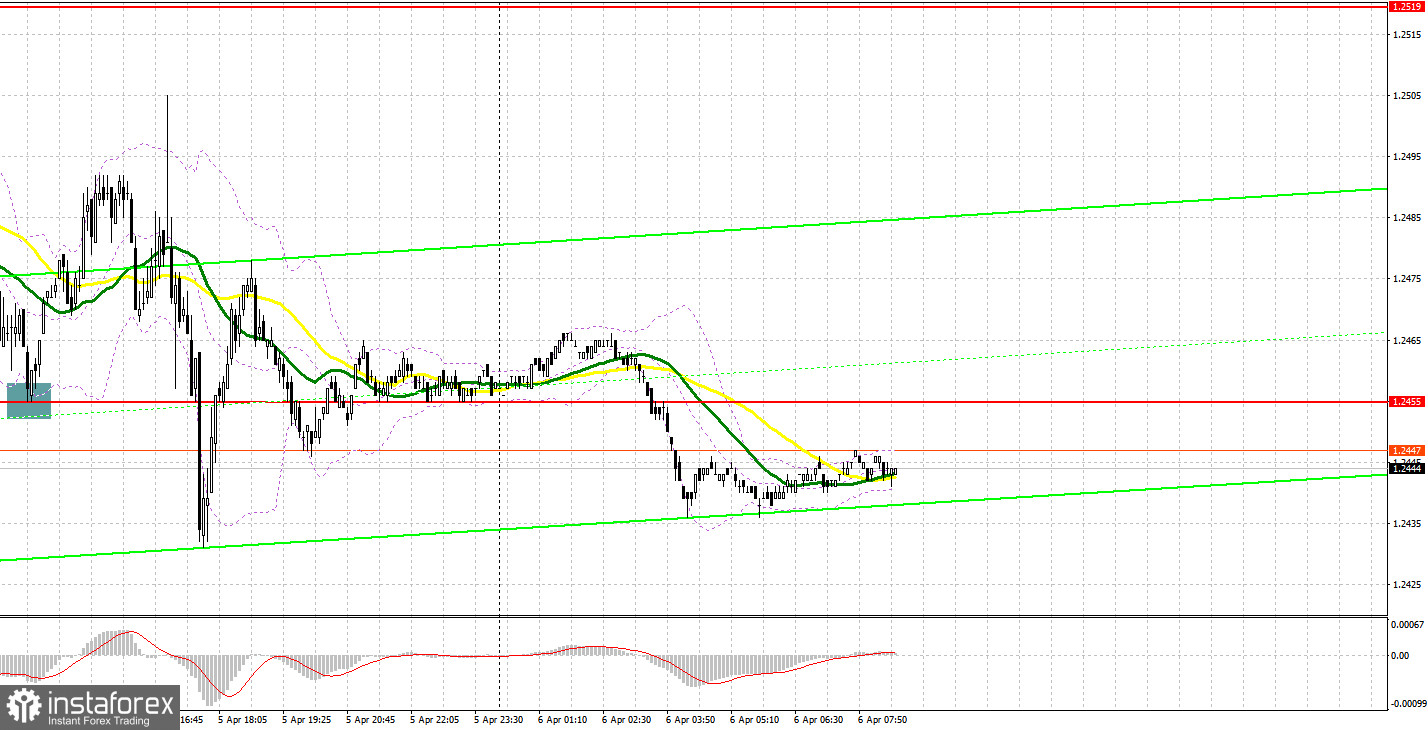
Yesterday, there was only one signal to enter the market. Now, let's look at the 5-minute chart and figure out what actually happened. Earlier, I asked you to pay attention to the level of 1.2455 to decide when to enter the market. A decline and false breakout at that level gave a buy signal, and the pair rose by more than 35 pips. I did not wait for any other signals.
Conditions for opening long positions on GBP/USD:
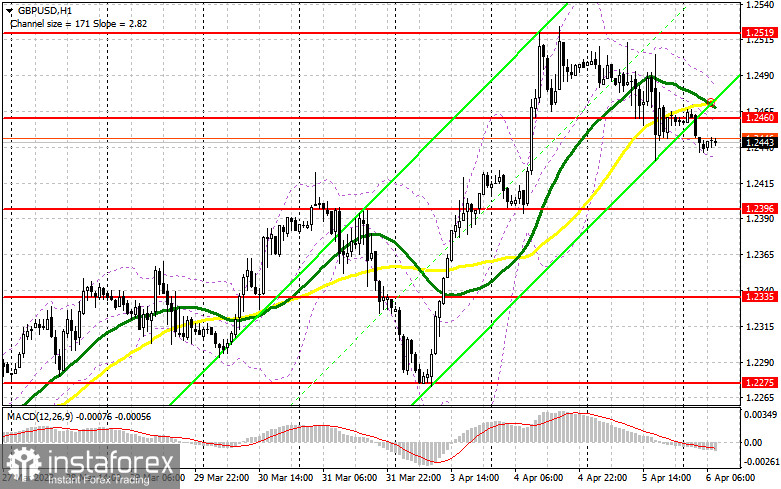
The UK will not release any important reports during the European session, therefore, it will be difficult for the bulls to gain control of the market and quickly end the bearish correction, which technically hasn't even started yet. The UK PMI for the construction sector is not really important, so I would suggest focusing on the pair's behavior around 1.2460, as moving averages benefiting the bears are in this area. If the pair consolidates there and undertakes a test, amid strong data, GBP/USD could reach a new monthly high of 1.2519. Following a breakout of this level, the pair could touch 1.2551, where I will take profit. If the pound is under pressure in the early afternoon, the bulls will have to defend the support level at 1.2396. A false breakout there is a good buy signal and GBP/USD could return to 1.2460. If the bulls fail and miss 1.2460, or if they are not very active there during the European session, we can expect a large correction. In this case, I would advise you not to rush into purchases and open long positions only near the support level of 1.2396. You could buy GBP/USD at a bounce from a low of 1.2335, keeping in mind an upward intraday correction of 30-35 pips.
Conditions for opening short positions on GBP/USD:
The bears need to be active around 1.2460, where the MAs pass. A false breakout there could provide a sell signal and that will bring down GBP/USD to 1.2396. After a breakout and an upward test, pressure on the pair will increase, this will give a sell signal with 1.2396 as the target. It will be a strong enough correction, which can break the uptrend. The low of 1.2335 remains the main target. If the pair tests it, it would nullify all plans of bullish traders for further upside movement of GBP/USD. If GBP/USD rises and there is no activity at 1.2460, which is also quite likely, it is best to postpone opening new long positions until the pair tests the new high of 1.2519. Only a false breakout of this level will provide an entry point for short positions. If there is no downside movement there, I will sell GBP/USD on a rebound immediately from the high of 1.2551, but only targeting an intraday correction of 30-35 pips.
COT report:
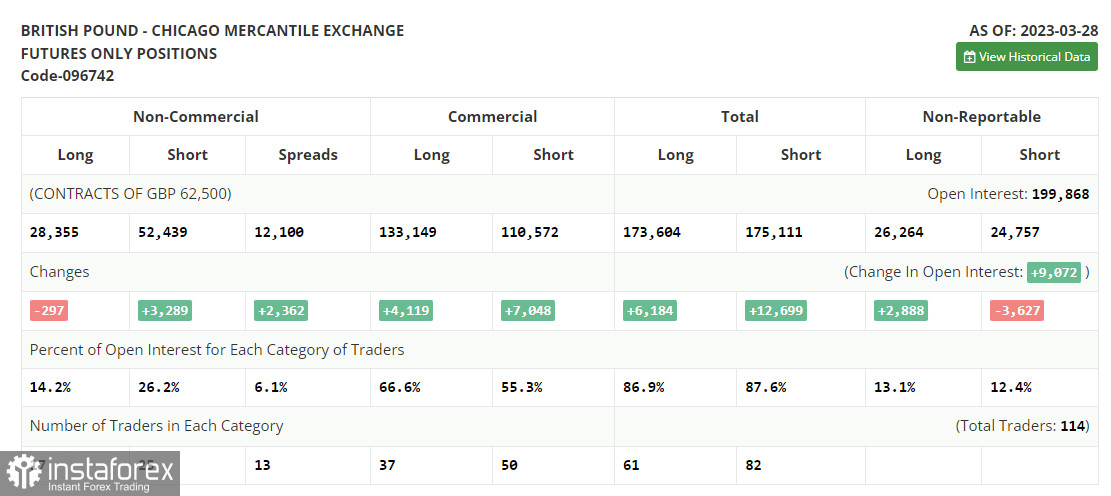
The Commitment of Traders (COT report) for March 28 noted that long positions decreased while short positions declined. In reality, there were no significant changes in the balance of power. The upwardly revised Q4 UK GDP data was enough to keep the pound sterling near monthly highs and return GBP to them at the beginning of this month. Statements made by BoE Governor Andrew Bailey led to anticipation of further interest rate hikes, which favored bullish traders. The latest COT report states that non-commercial short positions increased by 3,289 to 52,439, while non-commercial long positions decreased by 297 to 28,355, increasing the negative non-commercial net position to -24,084 compared to -20,498 a week earlier. The weekly closing price rose to 1.2358 from 1.2241.
Signals of indicators:
Moving Averages
Trading is performed below the 30- and 50-day moving averages, which indicates bearish sentiment.
Note: The author considers the period and prices of moving averages on the one-hour chart which differs from the general definition of the classic daily moving averages on the daily chart.
Bollinger Bands
In case of a decline, the lower limit of the indicator located around 1.2430 will act as support.
Description of indicators
- Moving average (a moving average determines the current trend by smoothing volatility and noise). The period is 50. It is marked in yellow on the chart.
- Moving average (a moving average determines the current trend by smoothing volatility and noise). The period is 30. It is marked in green on the graph.
- MACD indicator (Moving Average Convergence/Divergence - convergence/divergence of moving averages). A fast EMA period is 12. A slow EMA period is 26. The SMA period is 9.
- Bollinger Bands. The period is 20.
- Non-profit speculative traders are individual traders, hedge funds, and large institutions that use the futures market for speculative purposes and meet certain requirements.
- Long non-commercial positions are the total number of long positions opened by non-commercial traders.
- Short non-commercial positions are the total number of short positions opened by non-commercial traders.
- The total non-commercial net position is a difference in the number of short and long positions opened by non-commercial traders.


