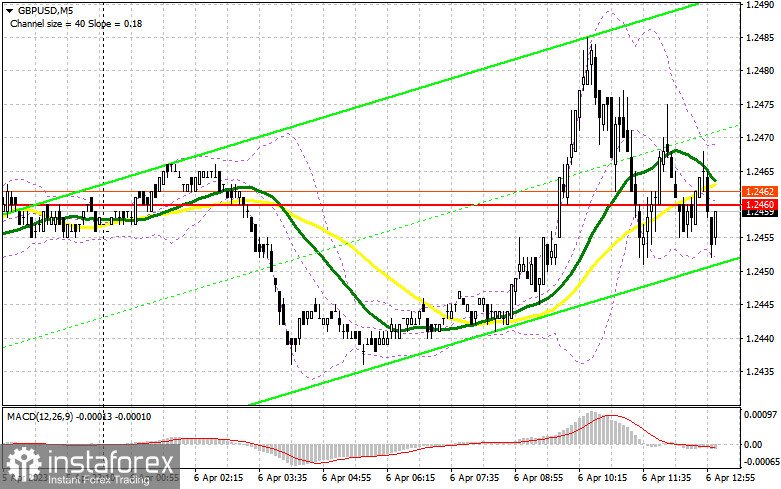
In my morning forecast, I highlighted the level of 1.2460 and advised traders to base their market entry decisions on it. Let's analyze the 5-minute chart to see what happened. The break of this level needed to be sufficient to generate a buy signal, as there were no buyers at 1.2460 during the reversal test. The price dropped below this range, resulting in a revision of the technical picture for the second half of the trading day.

To establish long positions on the GBP/USD, you must:
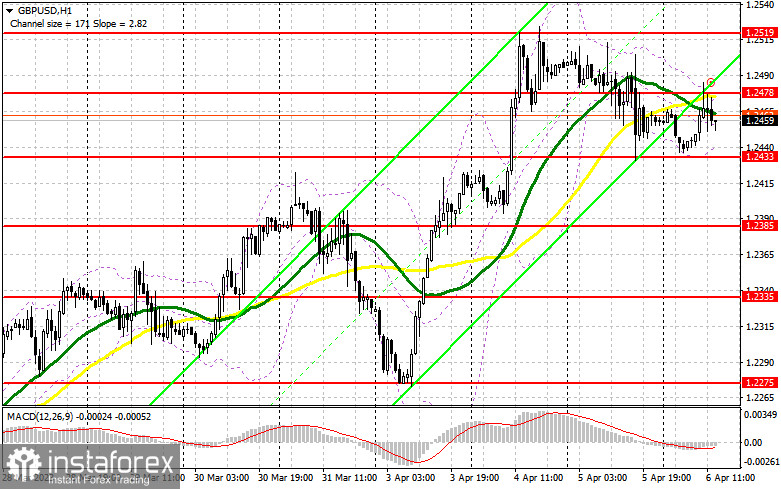
Buyers of the pound have not given up on a return to monthly highs, but this requires a justification that is now lacking. Positive statistics on the US labor market may increase pressure on the pair, which will return GBP/USD to the area of newly formed support of 1.2433 by the close of the morning session. The formation of a false breakout there will allow you to receive a buy signal, with the target being a newly established resistance of 1.2478 during the European session. Weak data on the number of new claims for unemployment benefits and a dovish statement by FOMC member James Bullard, in addition to consolidation and a top-down test of 1.2478, will provide a market entry point with a rise to 1.2519. The break of this range will open the way to my profit target of 1.2551. If the bulls cannot complete the assigned tasks and miss 1.2433 in the afternoon or show minimal activity there, you should anticipate a greater correction. In this instance, I will only open long positions on a false breakout in the area of the 1.2385 support. I intend to purchase GBP/USD immediately for a rebound from the minimum of 1.2335 to correct 30-35 points within a day.
To open short GBP/USD positions, you must have the following:
Since bears actively sold the pound at 1.2478 throughout the first half of the day, while trading will be conducted below this range, I expect the pair to decline and test the daily low around the support area of 1.2433. Given present market conditions, the best sell signal would be a false breakout around 1.2478, indicating the presence of major players anticipating a market correction. However, a break and retest of 1.2433 from the bottom up against the backdrop of dovish statements from Federal Reserve System representatives will also pressure GBP/USD, leading to an update of the 1.2385 level. Profit will be determined at the 1.2335 level, the farthest target. Considering the possibility of GBP/USD growth and no movement at 1.2478 in the afternoon, which is also fairly probable, it is prudent to delay sales until the test of the monthly high of 1.2519. Only a false breakout will provide a point of entry into short positions. Without a downward movement, I will sell GBP/USD for an immediate rebound from the day's high of 1.2551, but only if the pair corrects by 30-35 points during the day.

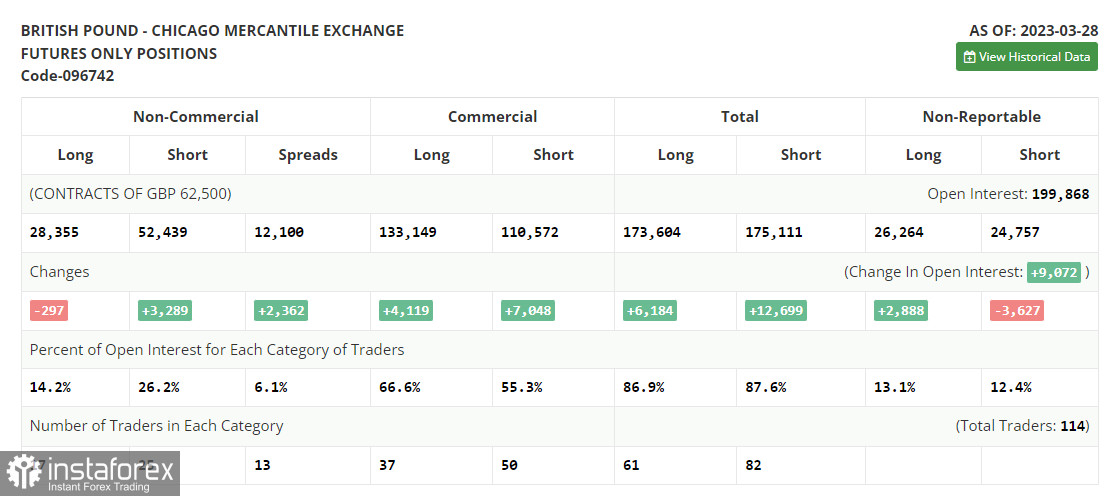
In the Commitment of Traders (COT) report for March 28, there was a decrease in long positions and a rise in short positions. In reality, there have been no major changes in the power balance. The reported statistics on the upward adjustment of the UK's fourth-quarter GDP growth rate were sufficient to hold the pound at monthly highs and return it to them at the start of this month. The words made by the Governor of the Bank of England, Andrew Bailey, were also sufficient to anticipate an additional increase in interest rates, which benefited buyers. The latest COT report indicates that short non-commercial positions increased by 3,289 to 52,439. In contrast, long non-commercial positions declined by 297 to 28,355, causing the non-commercial net position to grow to -24,084 from -20,498 the previous week. The weekly ending price increased from 1.224 to 1.2358.

Signals from indicators
Moving Averages
The fact that trading occurs between the 30- and 50-day moving averages demonstrate the lateral nature of the market.
The author considers the period and prices of moving averages on the hourly chart H1, which differs from the standard definition of daily moving averages on the daily chart D1.
Bollinger Bands
In the event of a decline, the indicator's lower limit near 1.2433 will act as support.
Description of indicators
- Moving average (moving average determines the current trend by smoothing out volatility and noise). Period 50. The graph is marked in yellow.
- Moving average (moving average determines the current trend by smoothing out volatility and noise). Period 30. The graph is marked in green.
- MACD indicator (Moving Average Convergence / Divergence - moving average convergence/divergence) Fast EMA period 12. Slow EMA period 26. SMA period 9
- Bollinger Bands (Bollinger Bands). Period 20
- Non-profit speculative traders, such as individual traders, hedge funds, and large institutions, use the futures market for speculative purposes and to meet certain requirements.
- Long non-commercial positions represent the total long open position of non-commercial traders.
- Short non-commercial positions represent the total short open position of non-commercial traders.
- Total non-commercial net position is the difference between the short and long positions of non-commercial traders.


