


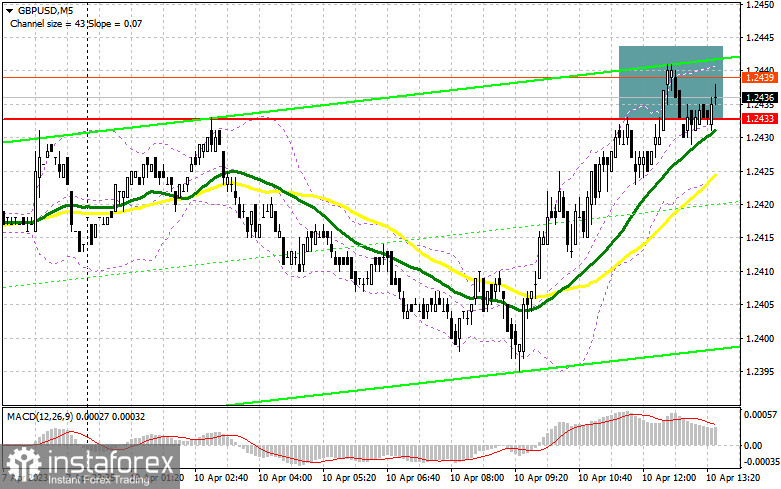
In my morning forecast, I paid close attention to the level of 1.2433 and recommended making entry decisions there. Let's analyze the 5-minute chart to determine what happened. The formation and growth of a false breakout at 1.2433 allowed us to obtain a sell signal, but as the chart demonstrates, it was not fully realized. The technical picture for the second part of the day has not changed.
To establish long positions on the GBP/USD, you must:
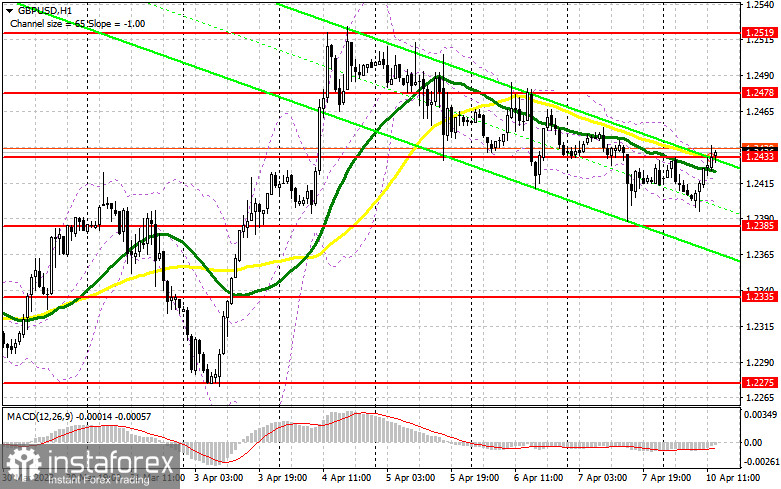
The dollar may reclaim its former strength due to the absence of U.S.-related news, resulting in the cancellation of the morning sell signal. Therefore, only a decline and the formation of a false breakout at 1.2385 will ensure that there are buyers of the pound on the market, signaling a favorable time to open long positions upon a return to 1.2433. A breakout and a test of this area from top to bottom provide another entry point for long positions with the potential for growth at 1.2478, and the monthly maximum of 1.2519 is very close, where I recommend taking profits. The farthest target will be in the area of 1.2551. In the event of a decline to the area of 1.2385 and a lack of bullish activity in the afternoon, it is prudent not to hurry into purchases. In this situation, I will only initiate long positions on a false collapse in the area of the next support of 1.2335. I intend to purchase GBP/USD promptly for a rebound from the 1.2275 minimum to correct 30-35 points within the trading day.
To initiate short GBP/USD positions, you must have the following:
Given that there are no statistics, sellers must appear around 1.2443; only then will they be able to maintain market control. After the speech of Fed representative John Williams, an upward movement is possible, so only a false breakout at 1.2433 will allow the downward correction to continue with the possibility of a 1.2385 breakthrough. A reverse bottom-up test of this range will increase pressure on the pound, forming a sell signal at 1.2335 upon a decline. This will be a significant enough correction to threaten the upward trend. The farthest target remains a minimum of 1.2275, the test of which will prevent all purchasers' plans for further pound growth. With the likelihood of GBP/USD growth and the lack of activity at 1.2433 during the American session, it is best to delay sales until the test of the 1.2478 maximum. Only a false breakout will provide a point of entry into short positions. Without a decline, I will sell GBP/USD for an immediate rebound from the maximum of 1.2519, but only if the pair corrects lower by 30-35 points within the day.
Signals from indicators
Moving Averages
The fact that trading occurs between the 30- and 50-day moving averages indicate the market's lateral nature.
The author considers the period and values of moving averages on the hourly chart H1, which differs from the classic definition of daily moving averages on the daily chart D1.
Bollinger Bands
In the event of a decline, the indicator's lower limit near 1.2405 will act as support.
Description of indicators
- Moving average (moving average determines the current trend by smoothing out volatility and noise). Period 50. The graph is marked in yellow.
- Moving average (moving average determines the current trend by smoothing out volatility and noise). Period 30. The graph is marked in green.
- MACD indicator (Moving Average Convergence / Divergence - moving average convergence/divergence) Fast EMA period 12. Slow EMA period 26. SMA period 9
- Bollinger Bands (Bollinger Bands). Period 20
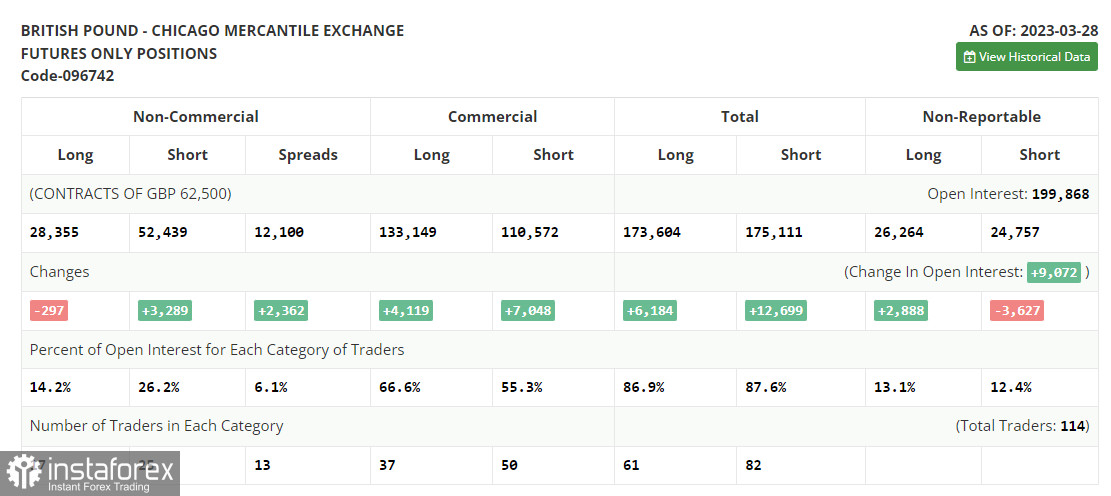
- Non-profit speculative traders, such as individual traders, hedge funds, and large institutions, use the futures market for speculative purposes and to meet certain requirements.
- Long non-commercial positions represent the total long open position of non-commercial traders.
- Short non-commercial positions represent the total short open position of non-commercial traders.
- Total non-commercial net position is the difference between the short and long positions of non-commercial traders.


