


Trend analysis (Fig. 1).
The market may move upward from the level of 1.0859 (closing of yesterday's daily candle) to the target of 1.0910, the 76.4% pullback level (red dotted line). Upon testing this level, a continued upward movement towards 1.0930, the historical resistance level (blue dotted line), is possible. After reaching this level, a downward correction is possible.
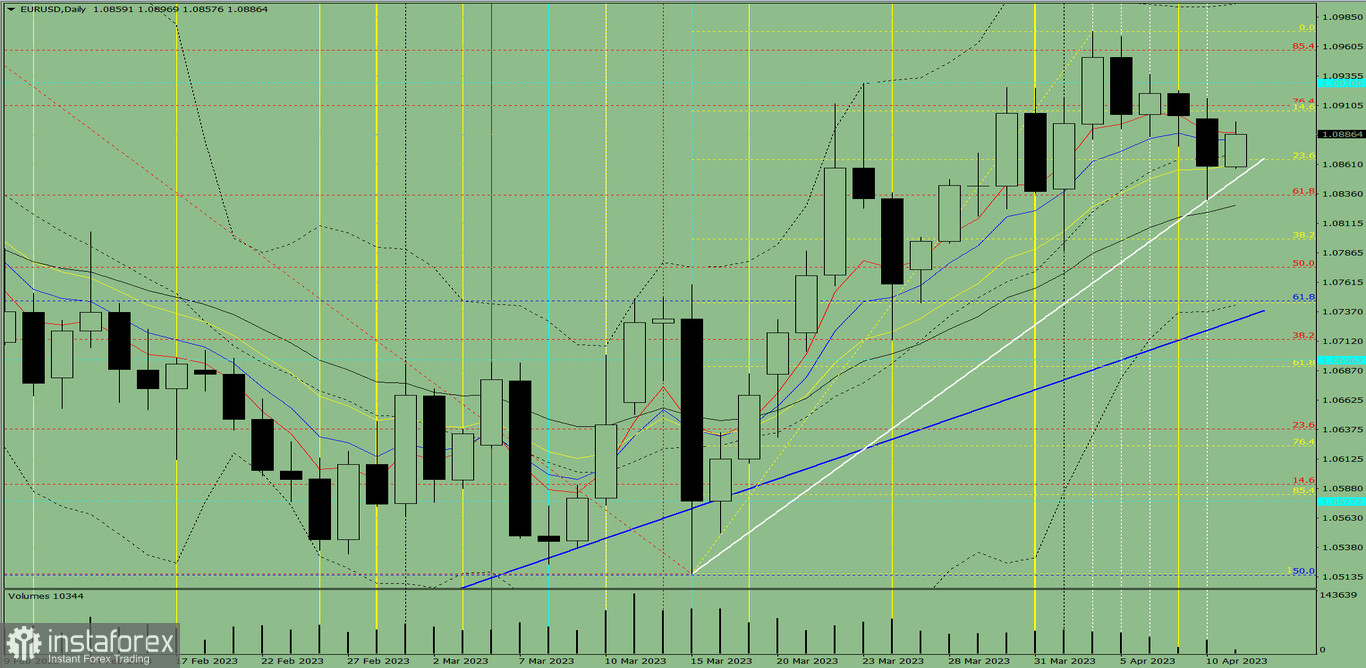
Fig. 1 (daily chart).
Comprehensive analysis:
- Indicator analysis - upward;
- Volumes - upward;
- Candle analysis - upward;
- Trend analysis - upward;
- Bollinger lines - upward;
- Weekly chart - upward.
Overall conclusion:
Today, the price may move upward from the level of 1.0859 (closing of yesterday's daily candle) to the target of 1.0910, the 76.4% pullback level (red dotted line). Upon testing this level, a continued upward movement towards 1.0930, the historical resistance level (blue dotted line), is possible. After reaching this level, a downward correction is possible.
Alternatively, the price may move upward from the level of 1.0859 (closing of yesterday's daily candle) to test 1.0910, the 76.4% pullback level (red dotted line). Upon testing this level, a downward movement towards 1.0865, the 23.6% pullback level (yellow dotted line), is possible.


