


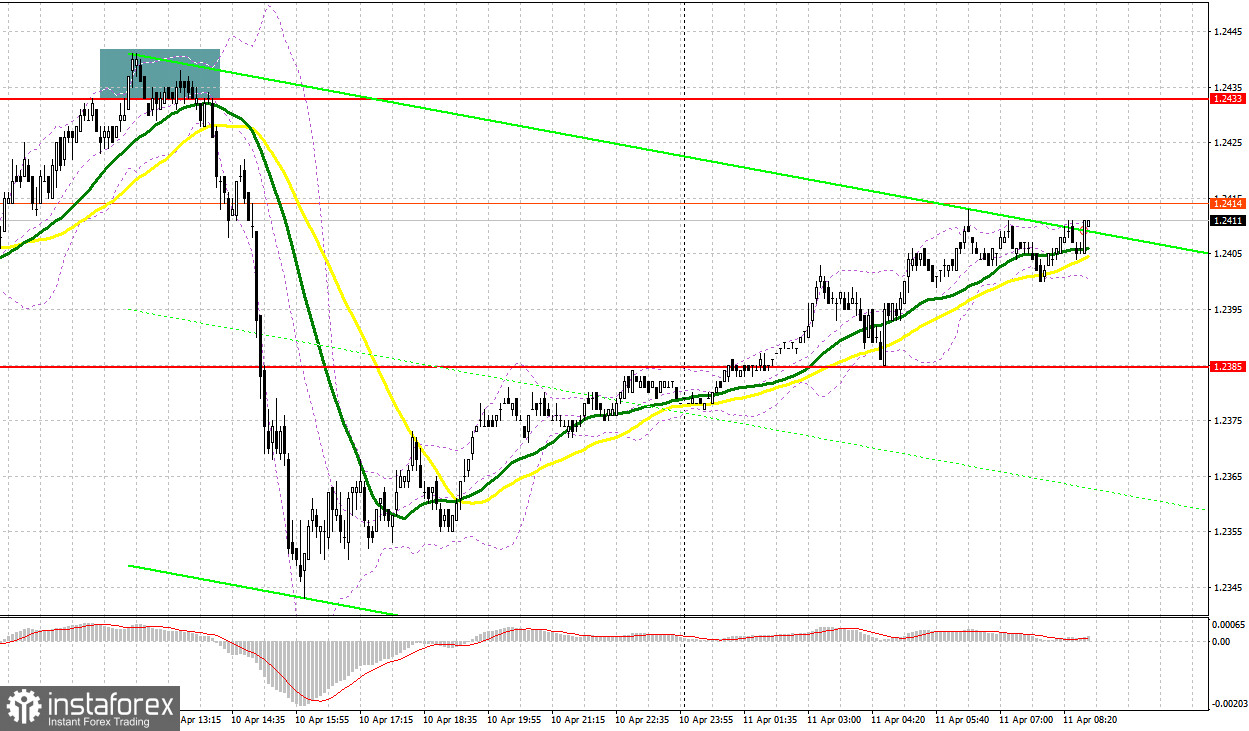
Yesterday, an excellent entry point was formed. Let's take a look at the M5 chart and figure out what happened. In my morning forecast, I drew attention to the level of 1.2433 and considered entering the market from it. Growth and a false breakout at 1.2433 generated a sell signal. As a result, the price fell by more than 80 pips. No entry points were formed in the North American session
When to open long positions on GBP/USD:
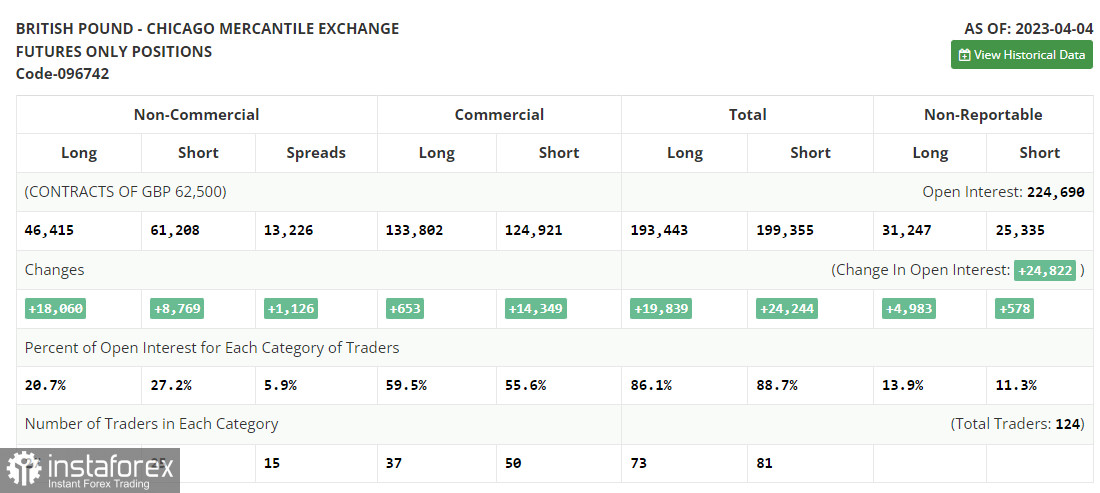
Before conducting technical analysis, let's see what happened in the futures market. The COT report for April 4 logged an increase in both long and short positions. However, this did not significantly affect the downside correction of the pair, which, judging by the chart, is gradually coming to an end. This week, new data on UK GDP is expected, which may be enough for the buyers to maintain control over the market and return to monthly highs. No statements from Bank of England representatives are expected. The market's reaction to US inflation and retail sales statistics is also very important. These figures may trigger a rally in the US dollar. The latest COT report states that short non-commercial positions increased by 8,769 to 61,109, while long non-commercial positions jumped by 18,060 to 46,415. As a result, non-commercial net positions came in at -14,793 versus -24,084 a week earlier. The weekly closing price rose to 1.2519 from 1.2241.
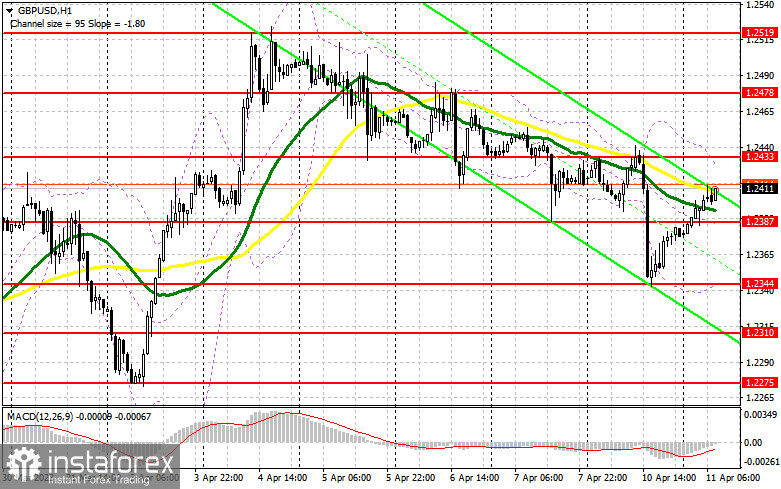
No macro releases are scheduled for today in the UK today, so the buyers may attempt to break yesterday's high. The current trading plan is to buy after a fall in value and a false breakout through new support at 1.2387, formed today. Slightly higher, there are the bullish moving averages. The target is seen at 1.2433. A breakout and a downside test of this range will create an additional buy signal, targeting 1.2478. Without this level, GBP/USD buyers will hardly see a bullish continuation. If the price goes above this range, we may expect growth to 1.2519, where I am going to take profit. In case of a decline in GBP/USD and the absence of buyers at 1.2387, the pair may face some pressure. If this happens, we open long positions at 1.2344 after a false breakout only. Likewise, we buy GBP/USD on a rebound from 1.2310, allowing a correction target of 30 to 35 pips intraday.
When to open short positions on GBP/USD:
The bulls will most likely try to break above the resistance level of 1.2433 in the first half of the day, so the sellers need to defend it all cost. A false breakout will create a sell signal, targeting the nearest support at 1.2387. A breakout and an upside retest of this range will create a sell entry, with the target at the 1.2344 low. The pair may then enter a new downtrend. The more distant target stands in the area of 1.2310, where I will lock in profits. If the GBP/USD rises and there are no bears at 1.2433, which is quite likely, the bull market will resume, leading to a spike in the GBP/USD to a new high of 1.2478. A false breakout at this level will form a sell entry point, with a possibility of a fall in price. In the absence of activity there as well, we sell GBP/USD from 1.2519, allowing a bearish correction of 30-35 pips intraday.
Indicator signals:
Moving averages
Trading takes place above the 30-day and 50-day moving averages, which indicates a bullish market.
Note: The period and prices of moving averages are viewed by the author on the hourly chart and differ from the general definition of classic daily moving averages on the daily chart.
Bollinger Bands
Resistance is seen around 1.2433, in line with the upper band. Support stands around 1.2344, in line with the lower band.
Description of indicators
- Moving average (MA) determines the current trend by smoothing volatility and noise. Period 50. Colored yellow on the chart.
- Moving average (MA) determines the current trend by smoothing volatility and noise. Period 30. Colored green on the chart.
- Moving Average Convergence/Divergence (MACD). Fast EMA 12. Slow EMA 26. SMA 9.
- Bollinger Bands. Period 20
- Non-commercial traders are speculators such as individual traders, hedge funds, and large institutions who use the futures market for speculative purposes and meet certain requirements.
- Long non-commercial positions are the total long position of non-commercial traders.
- Non-commercial short positions are the total short position of non-commercial traders.
- Total non-commercial net position is the difference between the short and long positions of non-commercial traders.


