


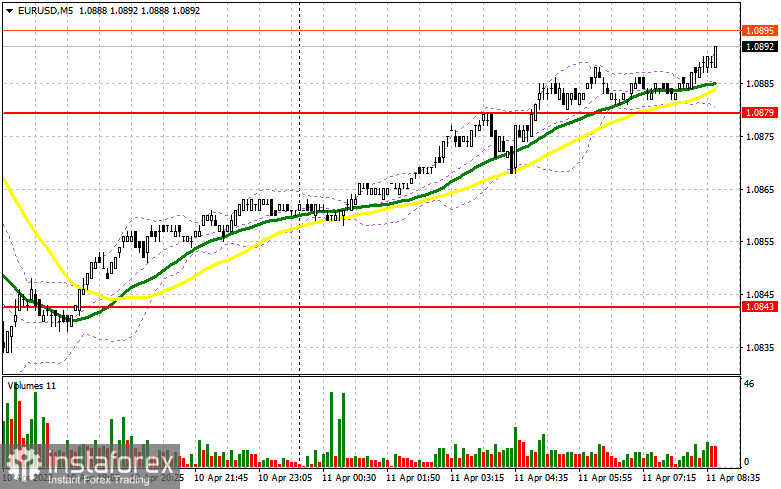
Yesterday, there were no clear signals to enter the market. Let's have a look at the 5-minute chart and see what happened there. In my morning review, I mentioned the level of 1.0907 as a possible entry point. However, due to low market volatility, there was no false breakout at the 1.0907 level, and the pair didn't form a buy signal after a retest. The euro's collapse in the second half of the day was then followed by a rapid rise which is why I missed the entry points and couldn't open any trades.
To open long positions on EUR/USD:
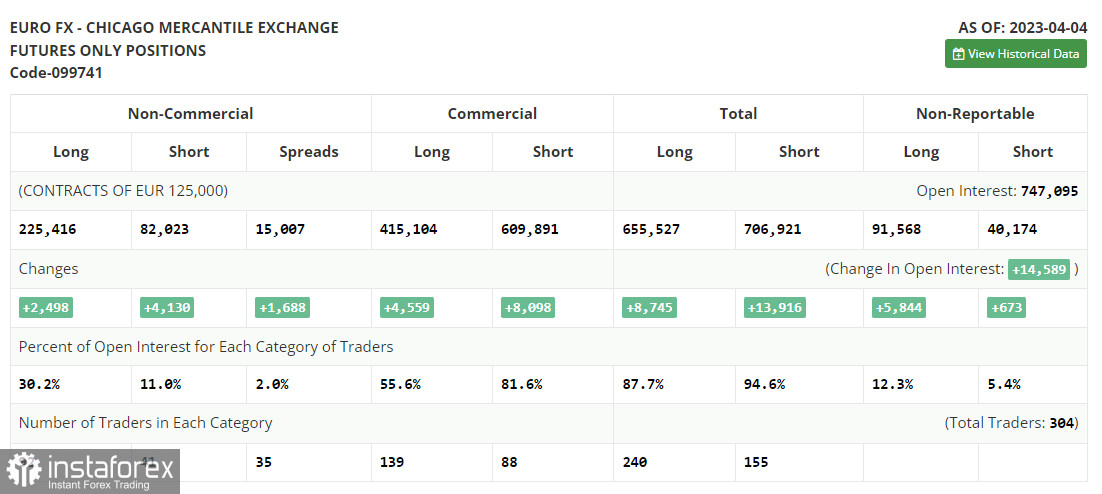
Before discussing the future trajectory of EUR/USD, let's take a look at what happened in the futures market and how the Commitments of Traders report has changed. The COT report for April 4th recorded an increase in both long and short positions. Considering that nothing particularly interesting happened last week, and the jobs data met market expectations, buyers of risk assets, including the euro, will be waiting for a crucial batch of inflation and retail sales data in the US for March. The minutes of the Federal Reserve's March meeting will also be of interest. If it suggests a need for further interest rate hikes, the US dollar may recover some of its recent losses. However, if the incoming data suggests that the Fed's monetary policy could be eased, the euro is likely to rise further. The COT report shows that long positions of the non-commercial group of traders increased by 2,498 to 225,416, while short positions jumped by 4,130 to 82,023. As a result, the total non-commercial net position fell to 143,393 from 145,025. The weekly closing price increased to 1.1 against 1.0896.
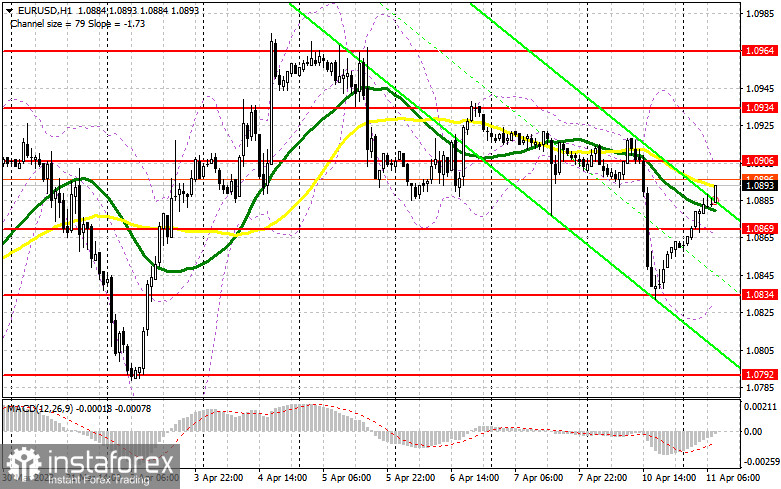
In the first half of the day, we expect the Sentix Investor Confidence Index in the eurozone and the data on retail sales. The latter is published for February this year and is unlikely to significantly impact the market. For this reason, the euro has a good chance to resume growth, especially given how quickly the bulls have recovered from yesterday's decline. If the reaction to the data is negative, the pair is likely to decrease, so I would recommend waiting for a better moment to go long. The best moment to enter the market would be a false breakout around the new support level of 1.0869 that was formed today. Moving averages located slightly above this level favor the bulls, offering a chance for the euro buyers. This could be a reason for opening long positions in anticipation of a further bullish trend. The nearest resistance is found at 1.0906 which the bulls failed to reach during the Asian session. A breakout and a downward retest of this range, along with strong statistics in the eurozone, will allow the pair to retest the 1.0934 level. If so, the pair may rise towards the monthly high of 1.0964. The level of 1.1002 will act as the highest target where I will be taking profit. If EUR/USD declines and there are no buyers at 1.0869, which is also quite likely, pressure on the euro will return. In this case, a false breakout around the next support at 1.0834 would be a reason to buy the instrument. I will open long positions on EUR/USD right after a rebound from a low of 1.0792 or 1.0748, keeping in mind an intraday upward correction of 30-35 pips.
To open short positions on EUR/USD:
Bears are not in a rush to return to the market, especially after losing the initiative. Most likely, today, the bulls will attempt to break above the high of 1.0906, so I recommend focusing on this level. The primary task for bears is to maintain control of this range. A false breakout after the eurozone retail sales data will generate a sell signal and lead to a downward movement towards the nearest support at 1.0869. A breakout, consolidation, and an upward retest of this level will form an additional signal to enter short positions, triggering stop-loss orders set by the bulls and pushing the pair down to 1.0834. The pair may break above this level only in the second half of the day, with the target at the support level of 1.0792. This is where I will be taking profit. If EUR/USD moves upwards during the European session and there are no bears at 1.0906, the bulls will maintain control over the market. In this case, it would be better to sell the pair only upon reaching the level of 1.0934. The formation of a false breakout there will become a new point for entering short positions. I will sell EUR/USD on a rebound from a high of 1.0964 or 1.1002, bearing in mind a downward correction of 30-35 pips.
Indicator signals:
Moving Averages
Trading above the 30- and 50-day moving averages indicates a further rise in the pair
Please note that the time period and levels of the moving averages are analyzed only for the H1 chart, which differs from the general definition of the classic daily moving averages on the D1 chart.
Bollinger Bands
If the pair declines, the lower band of the indicator at 1.0834 will serve as support. If the price goes up, the upper band of the indicator at 1.0906 will act as resistance.
Description of indicators:
• A moving average of a 50-day period determines the current trend by smoothing volatility and noise; marked in yellow on the chart;
• A moving average of a 30-day period determines the current trend by smoothing volatility and noise; marked in green on the chart;
• MACD Indicator (Moving Average Convergence/Divergence) Fast EMA with a 12-day period; Slow EMA with a 26-day period. SMA with a 9-day period;
• Bollinger Bands: 20-day period;
• Non-commercial traders are speculators such as individual traders, hedge funds, and large institutions who use the futures market for speculative purposes and meet certain requirements;
• Long non-commercial positions represent the total number of long positions opened by non-commercial traders;
• Short non-commercial positions represent the total number of short positions opened by non-commercial traders;
• The non-commercial net position is the difference between short and long positions of non-commercial traders.


