


Overview of trading on Monday
30M chart of GBP/USD
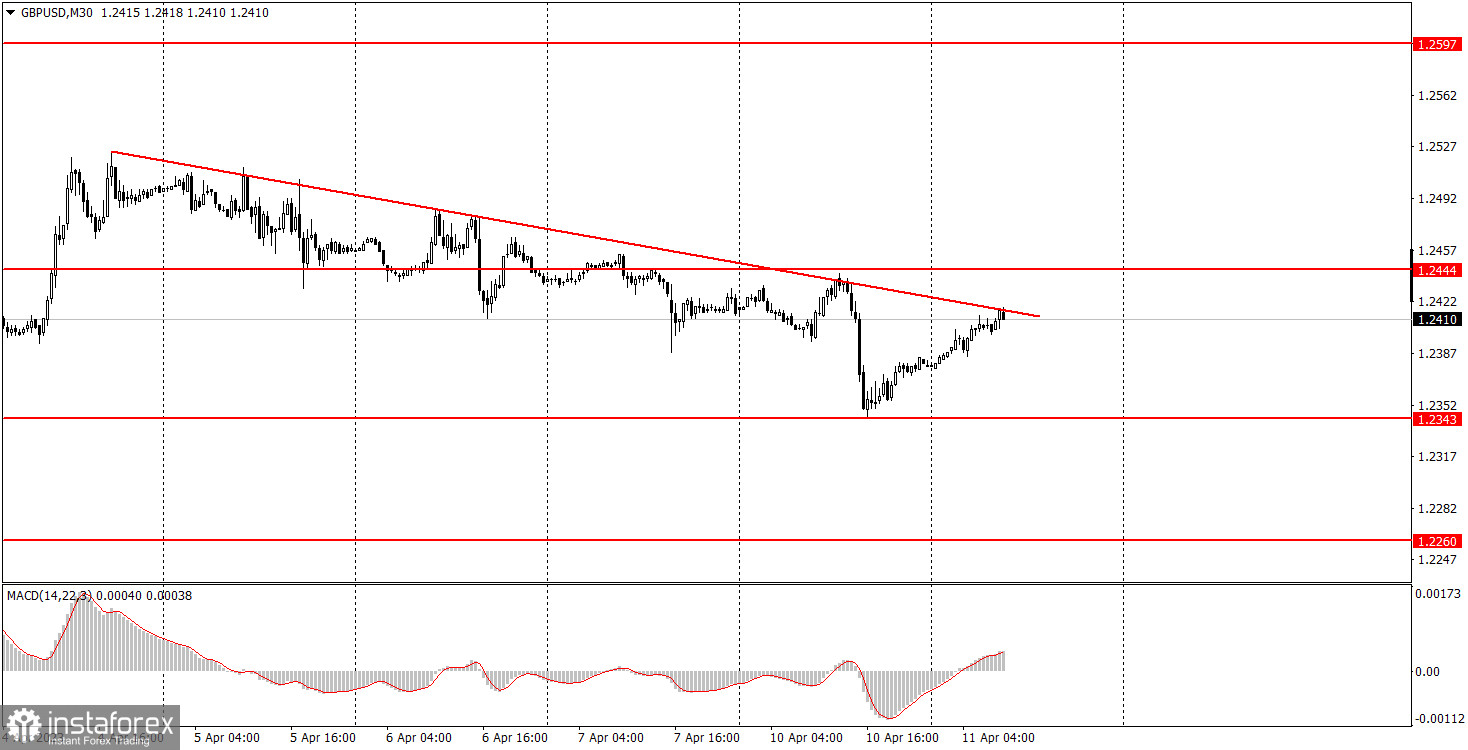
GBP/USD showed a very good movement on Monday. On early Monday, the pair bounced off the descending trend line, then dropped to the level of 1.2343, perfectly challenged it, and returned to the trend line today. Therefore, for the time being, the downtrend is still going on, so the instrument may generate a new signal for a trend change. If the trend line is surpassed, the British pound may resume its growth. This move would be illogical, especially amid the empty economic calendar on Monday and Tuesday. Nevertheless, the pound sterling has recently baffled traders with its illogical moves. By and large, the greenback's growth on Monday was almost certainly driven by Friday's statistics in the United States. The nonfarm payrolls were within the forecast, and the unemployment rate inched down again. On Friday, financial markets were closed for Good Friday, so the market gave its response to the NFPs on Monday when traders preferred to go long on the US dollar. The market was also holiday-thinned on Monday. However, the US dollar managed to grow marginally again.
5M chart of GBP/USD
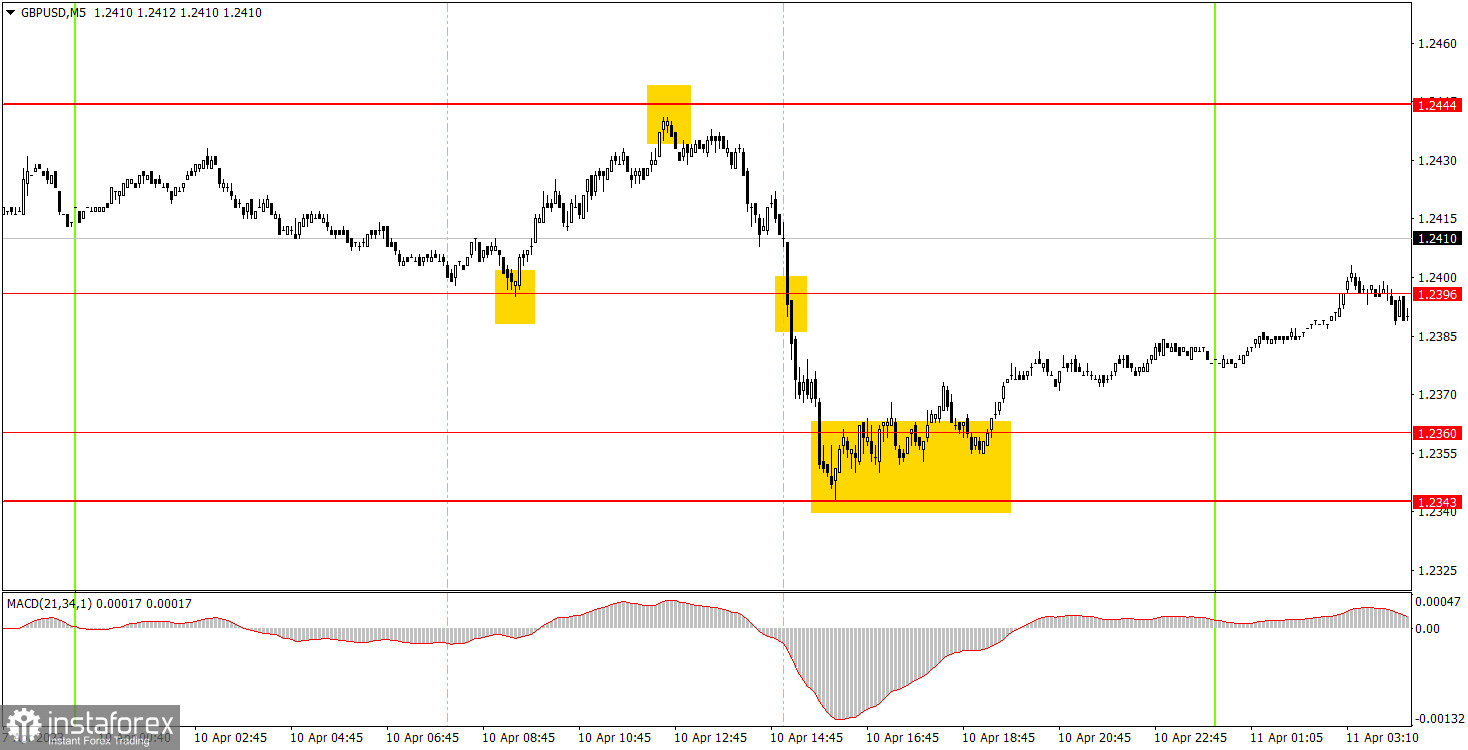
Trading signals on the 5-minute timeframe were almost perfect. In the early European trading hours, the GBP/USD bounced off the level of 1.2396, then grew to 1.2444 and worked it out with an error of 3 pips, which is quite acceptable for the pound. Beginner traders could have traded this price action with a long position and could have earned about 25 points on it. The drop from 1.2444 should have been traded with a short position. By the early American session, the price fell into the area of 1.2343-1.2360, which it could not overcome. When the price bounced from this area, it was appropriate to close short positions. Traders could have earned another 60 pips of profit. Trading the last buy signal was up to the traders' choice. The signal was formed quite late and it was not futile.
How to trade GBP/USD on Tuesday
On the 30-minute timeframe, the GBP/USD pair took a small break after its stunning rally. The descending trend line still supports the pound bears, but the trend line is not too steep, as is the downward trend. The market is still poised to buy the pair, although there are no convincing reasons for this. On the 5-minute timeframe, you can trade at the following levels: 1.2143, 1.2171-1.2179, 1.2245-1.2260, 1.2343-1.2360, 1.2396, 1.2444-1.2471, 1.2577-1.2616, and 1.2659-1.2674. When the price passes 20 pips in the right direction after opening a trade, you can set a Stop Loss at breakeven. On Tuesday, no important events and statistics are planned in the UK and the US. However, the market on Monday showed that GBP/USD can move very well despite the empty economic calendar. However, it doesn't make sense to rely on such market developments every day.
Basic rules of the trading system:
The strength of the signal is calculated by the time it took to form the signal (bounce/drop or overcoming the level). The less time it took, the stronger the signal.
If two or more trades were opened near a certain level due to false signals, all subsequent signals from this level should be ignored.
In a flat market, any currency pair can generate a lot of false signals or not generate them at all. But in any case, as soon as the first signs of a flat market are detected, it is better to stop trading.
Trades are opened in the time interval between the beginning of the European session and the middle of the American one when all trades must be closed manually.
On the 30-minute timeframe, you can trade based on MACD signals only on the condition of good volatility and provided that a trend is confirmed by the trend line or a trend channel.
If two levels are located too close to each other (from 5 to 15 points), they should be considered as an area of support or resistance.
Comments on charts
Support and resistance levels are levels that serve as targets when opening long or short positions. Take Profit orders can be placed around them.
Red lines are channels or trend lines that display the current trend and show which direction is preferable for trading now.
The MACD (14,22,3) indicator (histogram and signal line) is an auxiliary indicator that can also be used as a source of signals.
Important speeches and reports (always found in the economic calendar) can significantly influence the movement of a currency pair. Therefore, during their release, it is recommended to trade with utmost caution or to exit the market to avoid a sharp price reversal against the previous movement.
Beginners trading in the forex market should remember that not every trade can be profitable. Developing a clear strategy and money management is the key to success in trading over a long period of time.


