


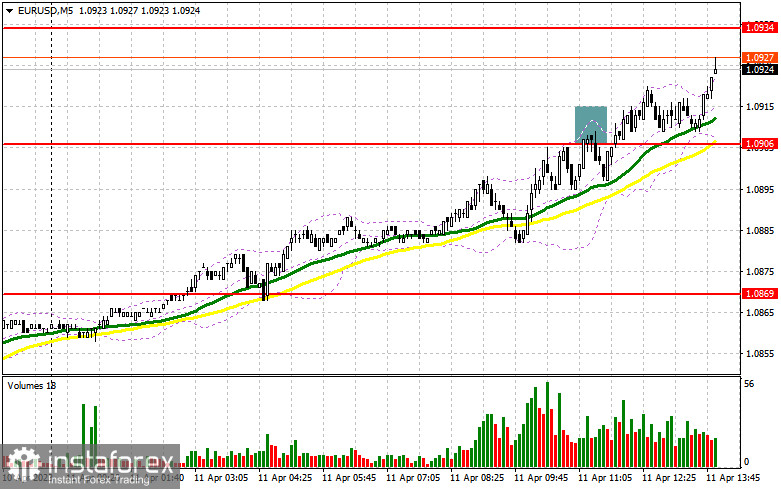
In my morning article, I turned your attention to 1.0906 and recommended making decisions with this level in focus. Now, let's look at the 5-minute chart and figure out what actually happened. A rise and a false breakout of that level provided entry points into short positions. However, the pair did not decline deeper. For the afternoon, the technical outlook was slightly revised.
When to open long positions on EUR/USD:
EUR bulls are likely to push the pair higher for the entire day. Traders may get new entry points into long positions at the support level of 1.0902 after strong US economic reports and the speeches of Fed policymakers. A false breakout of this level after the speeches of Ostan D. Goolsby and Patrick T. Harker, who will certainly touch on the topic of inflation and interest rates. It may generate a good entry point into long positions within the bullish trend. The pair could test 1.0934. A breakout and a downward retest of this level will give an additional buy signal with a return to the monthly high of 1.0964. A more distant target is located at 1.1002 where I recommend locking in profits. If EUR/USD drops and bulls show no activity at 1.0902 in the afternoon, which may happen if traders again start factoring in a further increase in interest rates, the pressure on the euro will increase. In this case, there could be a downward movement to 1.0869. Only a false breakout of this level will provide a buy signal. You could buy EUR/USD at a bounce from the low of 1.0834, keeping in mind an upward intraday correction of 30-35 pips.
When to open short positions on EUR/USD:
Sellers need to take control of 1.0906. Otherwise, the pair will rebound. They also should protect the resistance level of 1.0934. Now, the pair is aiming at this level. At this level, I expect large speculators to enter the market. It is better to open short positions after of a false breakout of this level. The hawkish comments of Fed policymakers will return pressure on the euro. It could cause a decline to the support level of 1.0902. A false breakout and an upward test of this level will push the pair to 1.0869. A fall below this level will also open the way to 1.0834. It will indicate the bearish trend in the market. At this level, I recommended locking in profits. If EUR/USD rises during the American session and bears show no energy at 1.0934, as it was in the morning at the level of 1.0906, I would advise you to postpone short positions until a false breakout of 1.0964. You could sell EUR/USD after a bounce from the high of 1.1002, keeping in mind a downward intraday correction of 30-35 pips.
COT report
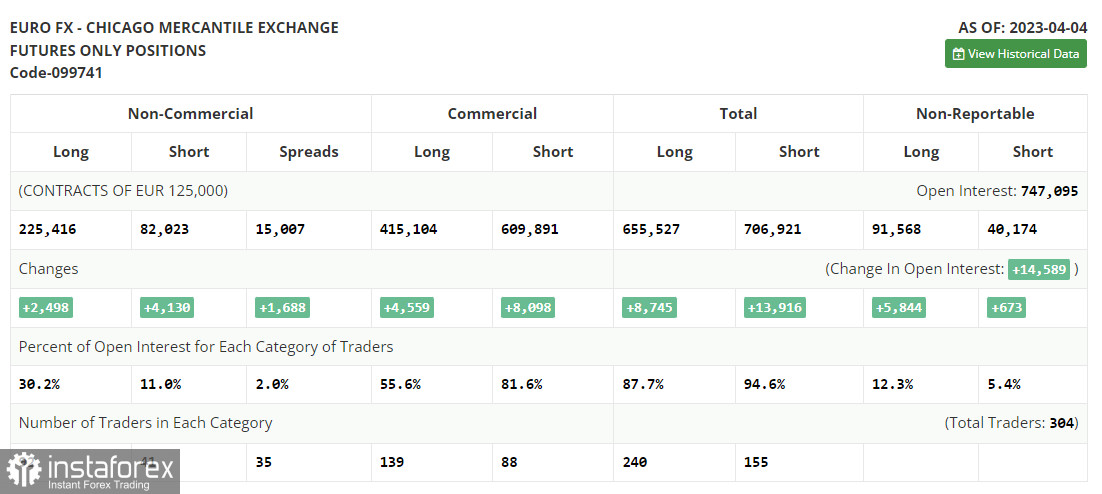
The COT report for April 4th recorded an increase in both long and short positions. Considering that nothing particularly interesting happened last week, and the jobs data met market expectations, buyers of risk assets, including the euro, will be waiting for a crucial batch of inflation and retail sales data in the US for March. The minutes of the Federal Reserve's March meeting will also be of interest. If it suggests a need for further interest rate hikes, the US dollar may recover some of its recent losses. However, if the incoming data suggests that the Fed's monetary policy could be eased, the euro is likely to rise further. The COT report shows that the long positions of the non-commercial group of traders increased by 2,498 to 225,416, while short positions jumped by 4,130 to 82,023. As a result, the total non-commercial net position fell to 143,393 from 145,025. The weekly closing price increased to 1.1 against 1.0896.
Indicators' signals:
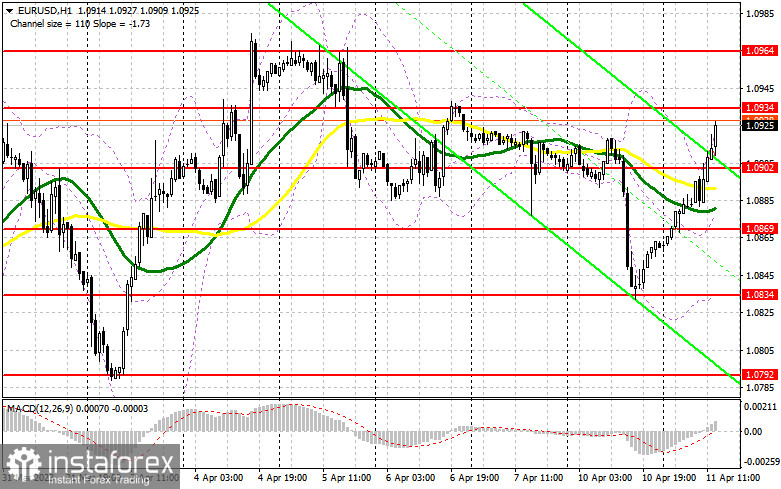
Trading is carried out above the 30 and 50 daily moving averages, which indicates further growth.
Moving averages
Note: The period and prices of moving averages are considered by the author on the H1 (1-hour) chart and differ from the general definition of the classic daily moving averages on the daily D1 chart.
Bollinger Bands
If EUR/USD declines, the indicator's lower border at 1.0835 will serve as support.
Description of indicators
- Moving average (moving average, determines the current trend by smoothing out volatility and noise). Period 50. It is marked yellow on the chart.
- Moving average (moving average, determines the current trend by smoothing out volatility and noise). Period 30. It is marked green on the chart.
- MACD indicator (Moving Average Convergence/Divergence - convergence/divergence of moving averages) Quick EMA period 12. Slow EMA period to 26. SMA period 9
- Bollinger Bands (Bollinger Bands). Period 20
- Non-commercial speculative traders, such as individual traders, hedge funds, and large institutions that use the futures market for speculative purposes and meet certain requirements.
- Long non-commercial positions represent the total long open position of non-commercial traders.
- Short non-commercial positions represent the total short open position of non-commercial traders.
- Total non-commercial net position is the difference between the short and long positions of non-commercial traders.


