


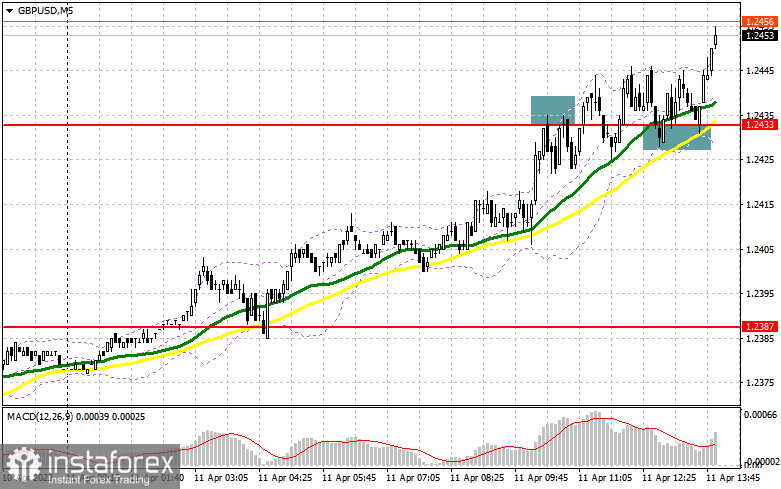
In the previous forecast, I drew your attention to the level of 1.2433 and recommended making entry decisions from it. Let's have a look at the 5-minute chart and analyze the situation in the market. The GBP/USD pair soared and formed a false breakout at 1.2433, creating a sell signal. However, traders did not use it. After that, the British pound broke through and tested 1.2433, forming a buy signal. At the time of writing, the pair has risen by about 20 pips. In the second half of the day, the technical picture remains unchanged.
Long positions on GBP/USD:
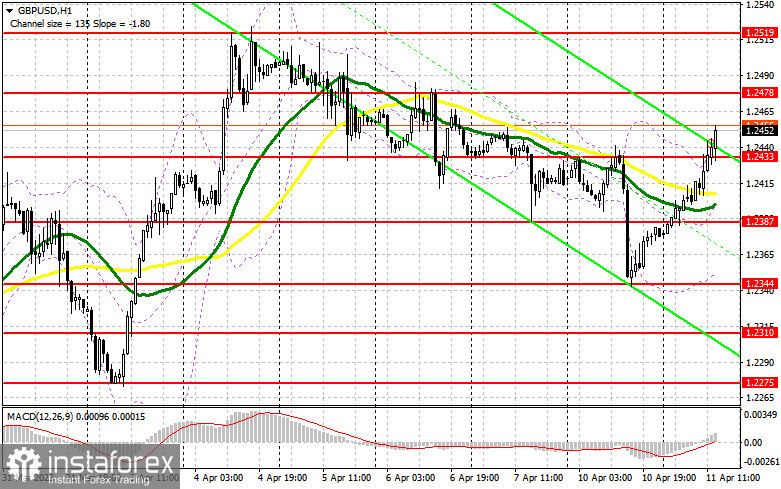
It is unlikely that the British pound may lose ground after the release of the NFIB small business optimism indicator and the speeches of FOMC members Austan D. Goolsbee and Patrick T. Harker. However, if it does happen, it would be good to see bullish activity near the support of 1.2433, which served as resistance earlier. Only a decline and a false breakout at 1.2433 may give a buy signal with the target at the resistance of 1.2478, toward which bulls are trying to push the price. If the price pierces this level amid dovish statements of the FOMC representatives, we can count on an entry point into long positions, targeting a monthly high of 1.2519, where traders may book their profits. The next target is located in the area of 1.2551. If the GBP/USD pair plummets to the area of 1.2433 and we see weak bullish activity in the second half of the day, it is better to postpone opening long positions. In this case, it would be better to open long positions after a false breakout near the support of 1.2387. The moving averages are located slightly above this level. Notably, the MAs are supporting bulls. One may buy the British pound on a rebound from the low of 1.2344, allowing an intraday correction of 30-35 pips.
Short position on GBP/USD:
Considering that bulls failed to defend 1.2433, they need to fix the price above this level now. There will be no other chance to maintain market balance. At the same time, if the Fed representatives are quite dovish in their statements, one may consider short positions after an increase and a false breakout at 1.2478. Following this scenario, the British currency is likely to tumble to 1.2433. If the price performs a bottom/top test of this level, it is likely to give a sell signal and drag the pair down to 1.2387, where bears will face a strong bullish counteraction. The next target is located at the low of 1.2344. If the price moves below this level, the bullish scenario is likely to be canceled. On the contrary, if the GBP/USD pair increases and we see a lack of trading activity near 1.2478 during the US session, it is better to refrain from opening short positions until the price tests 1.2519. A false breakout at this level may give an entry point into short positions. If the pair does not decline near that level, one may sell the British pound on a rebound from the high of 1.2551, allowing an intraday correction of 30-35 pips.
Signals of indicators:
Moving Averages
The pair is trading slightly above the 30- and 50-day moving averages, indicating that the price may continue to grow.
Note: The period and prices of moving averages are considered by the author on the hourly chart H1 and differ from the general definition of classic daily moving averages on the daily chart D1.
Bollinger Bands
If the pair declines, the lower boundary of the indicator near 1.2350 will offer support.
Description of indicators
- Moving average defines the current trend by smoothing out volatility and noise. Period 50. Marked in yellow on the chart;
- Moving average defines the current trend by smoothing out volatility and noise. Period 30. Marked in green on the chart;
- MACD (Moving Average Convergence/Divergence) indicator. Fast EMA 12. Slow EMA 26. SMA 9;
- Bollinger Bands (Bollinger Bands). Period 20;
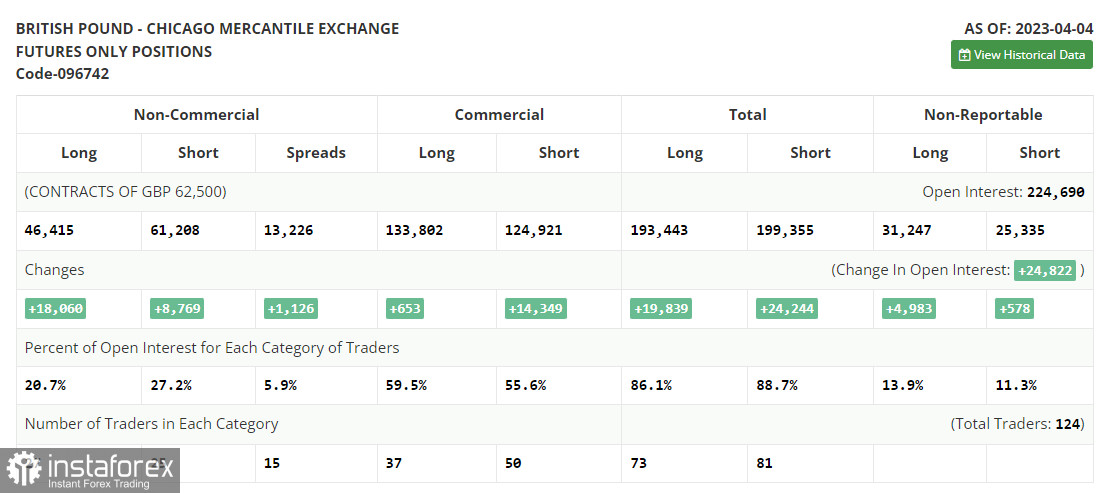
- Non-commercial traders are speculators, such as individual traders, hedge funds, and large institutions, which use the futures market for speculative purposes and meet certain requirements;
- Long non-commercial positions represent the total long open position of non-commercial traders;
- Short non-commercial positions represent the aggregate short open position of non-commercial traders;
- Total non-commercial net position is the difference between short and long positions of non-commercial traders.


