


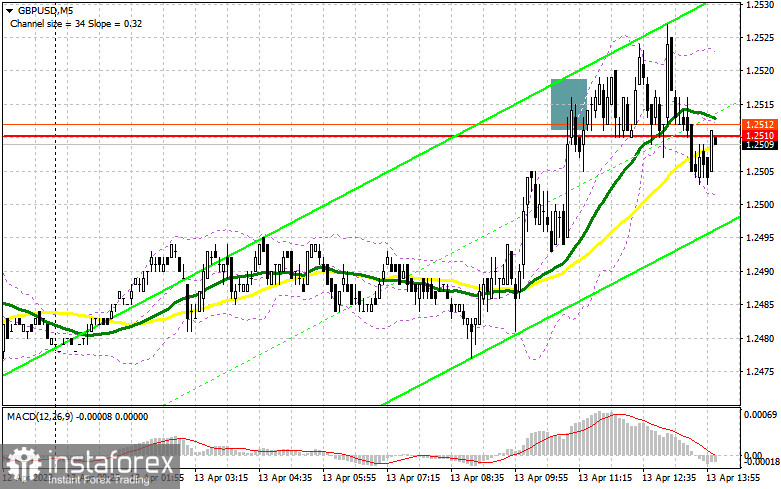
In my morning forecast, I called attention to the level of 1.2512 and recommended making decisions about entering the market from there. Let's look at the 5-minute chart and figure out what happened there. Growth and the formation of a false breakout at 1.2512 provided a sell signal, but, as you can see on the chart, it was not fully realized. After consolidating above 1.2512 and trading at this level, I decided to exit the sale. The technical picture changed a bit for the second half of the day.
To open long positions on GBP/USD, it is necessary:
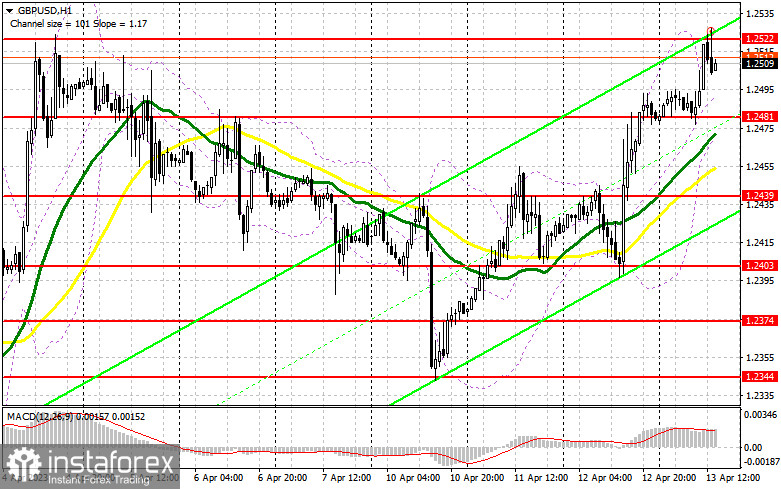
The quite mixed statistics on the UK economy did not significantly harm the bullish trend, allowing buyers to reach and update the monthly maximum. Whether the pound can continue to grow is difficult to say. This requires weak data from the US, especially on producer prices, which, following the main consumer price index, should also show a significant decrease. If this does not happen, pressure on GBP/USD may increase, leading to a downward correction. I expect to meet large buyers in the area of the nearest support at 1.2481, just below which the moving averages are playing on the side of the bulls. Only the formation of a false breakout there will provide a good signal to open long positions to resume pound growth and return to the monthly maximum of 1.2522 - resistance formed during the first half of the day. A breakthrough and testing of this area from top to bottom against the backdrop of hawkish rhetoric from Bank of England representatives and rapidly falling inflation in the US will provide even greater momentum and an entry point for long positions with the prospect of growth to 1.2556. The ultimate target will be around 1.2592, where I recommend fixing the profit. In the scenario of a decline to the area of 1.2481 and the absence of activity from the bulls in the second half of the day, it is best not to rush with purchases. In this case, I will open long positions only on a false breakout in the area of the next support at 1.2439. I plan to buy GBP/USD immediately on a rebound only from the minimum of 1.2403, with a correction target within 30-35 points during the day.
To open short positions on GBP/USD, it is necessary:
Pound sellers showed themselves in the area of the monthly maximum, but as you can see, no significant pressure was formed, so don't be surprised if the bulls prevailed on the second attempt. For this reason, if the bears intend to offer something, they should do it here and now, as there will be no other chance to hold the market against a new bullish trend. Only the defense and formation of a false breakout at 1.2522 after releasing a series of fundamental statistics on the US will be an excellent signal to sell the pound, with the prospect of a correction in the area of the nearest support of 1.2481. A breakthrough and reverse test from the bottom to the top of this range will intensify the pressure on the pair, forming a sell signal with a drop to 1.2439, where the bears will again encounter active actions from pound buyers. The ultimate target remains the minimum of 1.2403. In the case of GBP/USD growth and the absence of activity at 1.2522 during the American session, which is more likely, it is best to postpone sales until the test of the next resistance at 1.2556. Only a false breakout will provide an entry point for short positions. In the absence of downward movement there, I will sell GBP/USD on a rebound from 1.2592, expecting a correction of the pair down by 30-35 points during the day.
Indicator signals:
Moving averages
Trading is conducted above the 30 and 50-day moving averages, indicating further pair growth.
Note: The author on the H1 chart considers the period and prices of moving averages and differ from the general definition of classic daily moving averages on the D1 chart.
Bollinger Bands
In case of a decline, the lower border of the indicator will act as support in the area of 1.2480.
Description of indicators
• Moving average (determines the current trend by smoothing volatility and noise). Period 50. Marked in yellow on the chart.
• Moving average (determines the current trend by smoothing volatility and noise). Period 30. Marked in green on the chart.
• MACD indicator (Moving Average Convergence/Divergence - convergence/divergence of moving averages) Fast EMA period 12. Slow EMA period 26. SMA period 9
• Bollinger Bands. Period 20
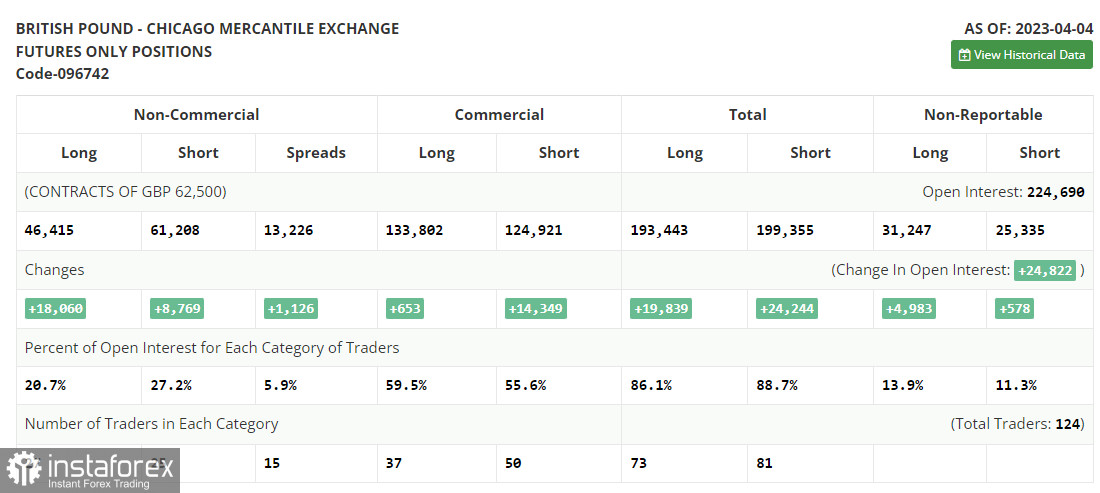
• Non-commercial traders - speculators, such as individual traders, hedge funds, and large institutions, using the futures market for speculative purposes and meeting certain requirements.
• Long non-commercial positions represent the total long open position of non-commercial traders.
• Short non-commercial positions represent the total short open position of non-commercial traders.
• The total non-commercial net position is the difference between the short and long positions of non-commercial traders.


