


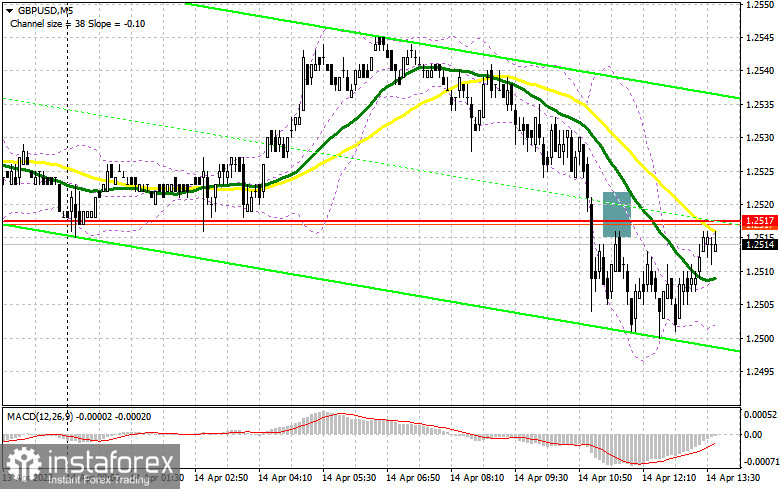
In my morning forecast, I called attention to the level of 1.2517 and recommended making decisions on entering the market from it. Let's look at the 5-minute chart and figure out what happened there. The breakthrough and retest of this range led to a sell signal, but it didn't result in a significant drop. After a 15-point downward movement, pressure on the pair weakened. This led to a revision of the technical picture for the second half of the day.
To open long positions on GBP/USD, it is required:
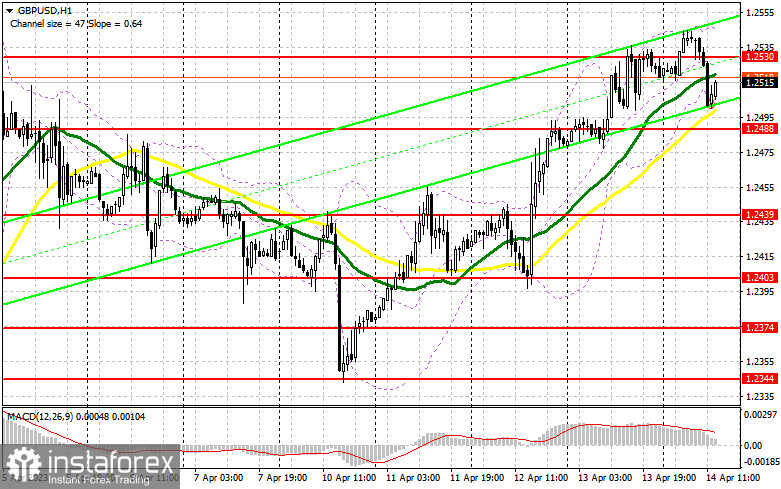
The absence of British statistics and the desire to buy at highs led to a downward movement of the pound, but all of this is within the technical correction. However, during the American session, bears may take advantage of strong US statistics and push the pound even lower, returning the pair to the sideways channel. This would require very good retail sales, industrial production figures, positive consumer sentiment indices from the University of Michigan, and inflation expectations. In the second half of the day, before plunging even lower, bulls will try to regain control of the new resistance at 1.2530. Of course, a more optimal scenario would be a decline in the pair and purchases on a false breakout from 1.2488. This would allow for an entry point in the market with the goal of a breakthrough and consolidation above 1.2530. A top-down test of this level on weak US data will return the bullish character to the market, giving a buy signal with the renewal of the April maximum of around 1.2561. A further target will be the area of 1.2593, where I will fix the profit. If there is a decline to 1.2488 and no activity from the bulls in the second half of the day, it is better to take your time with purchases. In this case, I will open long positions only on a false breakout in the area of the next support at 1.2439. I plan to buy GBP/USD immediately on the rebound only from the minimum of 1.2403, with the goal of a correction of 30-35 points within the day.
To open short positions on GBP/USD, it is required:
Pound sellers have shown themselves, and now they must protect the new resistance at 1.2530 with all their might. With it, they will retain all their initiative again. Only the protection and formation of a false breakout at 1.2530 after releasing a series of fundamental US statistics will become an excellent sell signal for the pound, with the prospect of a correction towards the nearest support at 1.2488. A breakthrough and reverse test from the bottom to the top of this range will increase pressure on the pair, forming a sell signal with a drop to 1.2439, where the bears will again face active actions from pound buyers. The furthest target remains at a minimum of 1.2403. In the case of GBP/USD growth and the absence of activity at 1.2530 during the American session, which is more likely, it is best to postpone sales until the test of the next resistance at 1.2561 – the new monthly maximum. Only a false breakout there will give an entry point for short positions. If there is no downward movement, I will sell GBP/USD on a rebound from 1.2593, counting on a correction of the pair downwards by 30-35 points within the day.
Indicator signals:
Moving averages
Trading occurs around the 30 and 50-day moving averages, indicating market uncertainty about the pair's future direction.
Note: The author on the H1 chart considers the moving average period and prices and differ from the general definition of classical daily moving averages on the D1 chart.
Bollinger Bands
In case of a decline, the lower border of the indicator will act as support in the region of 1.2500.
Description of indicators
• Moving average (determines the current trend by smoothing volatility and noise). Period 50. Marked in yellow on the chart.
• Moving average (determines the current trend by smoothing volatility and noise). Period 30. Marked in green on the chart.
• MACD indicator (Moving Average Convergence/Divergence - convergence/divergence of moving averages) Fast EMA period 12. Slow EMA period 26. SMA period 9
• Bollinger Bands. Period 20
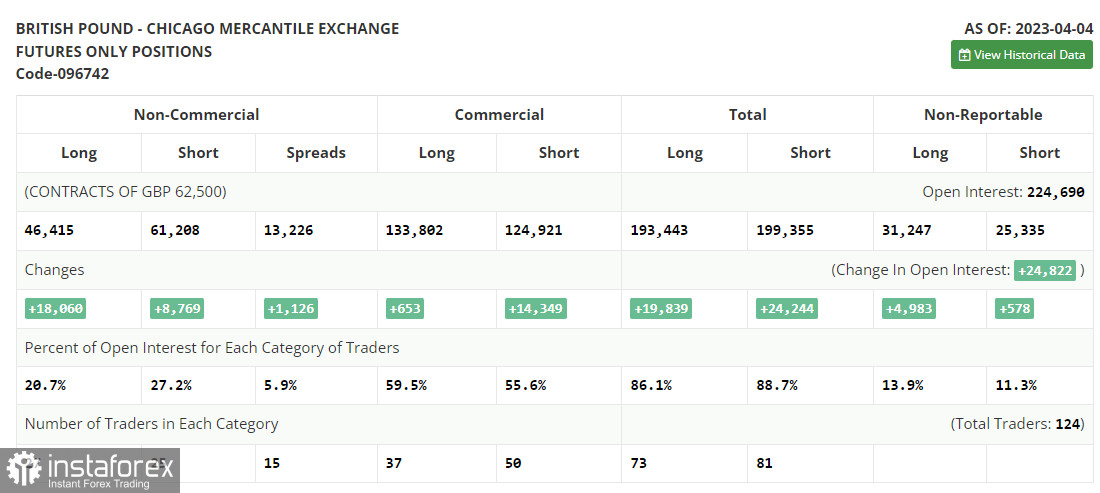
• Non-commercial traders - speculators, such as individual traders, hedge funds, and large institutions, using the futures market for speculative purposes and meeting specific requirements.
• Long non-commercial positions represent the total long open position of non-commercial traders.
• Short non-commercial positions represent the total short open position of non-commercial traders.
• The total non-commercial net position is the difference between the short and long positions of non-commercial traders.


