


Analyzing Friday's trades:
EUR/USD on 30M chart
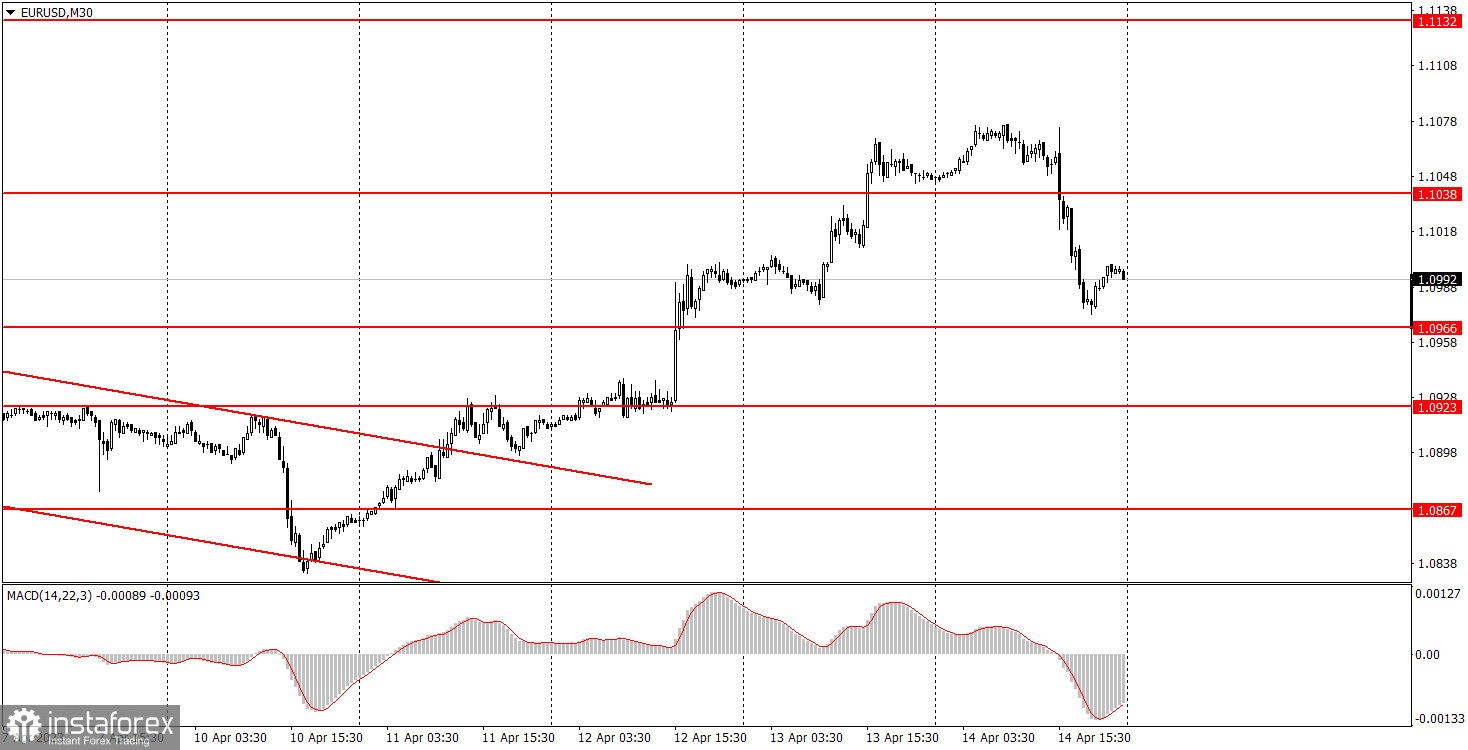
The EUR/USD pair unexpectedly fell on Friday. In fact, the decline has been looming for quite some time, so from this perspective, everything is normal. The dollar grew due to the macroeconomic background, since the US released several reports and they turned out to be quite contradictory. There were those that could support the dollar and those that didn't. Considering that they weren't highly important, the dollar's 100 point growth during the day was clearly not provoked by the reports. Nevertheless, it is worth noting that retail sales contracted more than estimated, and industrial production grew stronger than expected. Of course, we expect that Friday's decline will mark the beginning of a new downtrend, at least on the 30-minute chart. However, let us recall that in the last three or four instances when the pair formed a strong signal for a downtrend, the pair did not fall.
EUR/USD on 5M chart
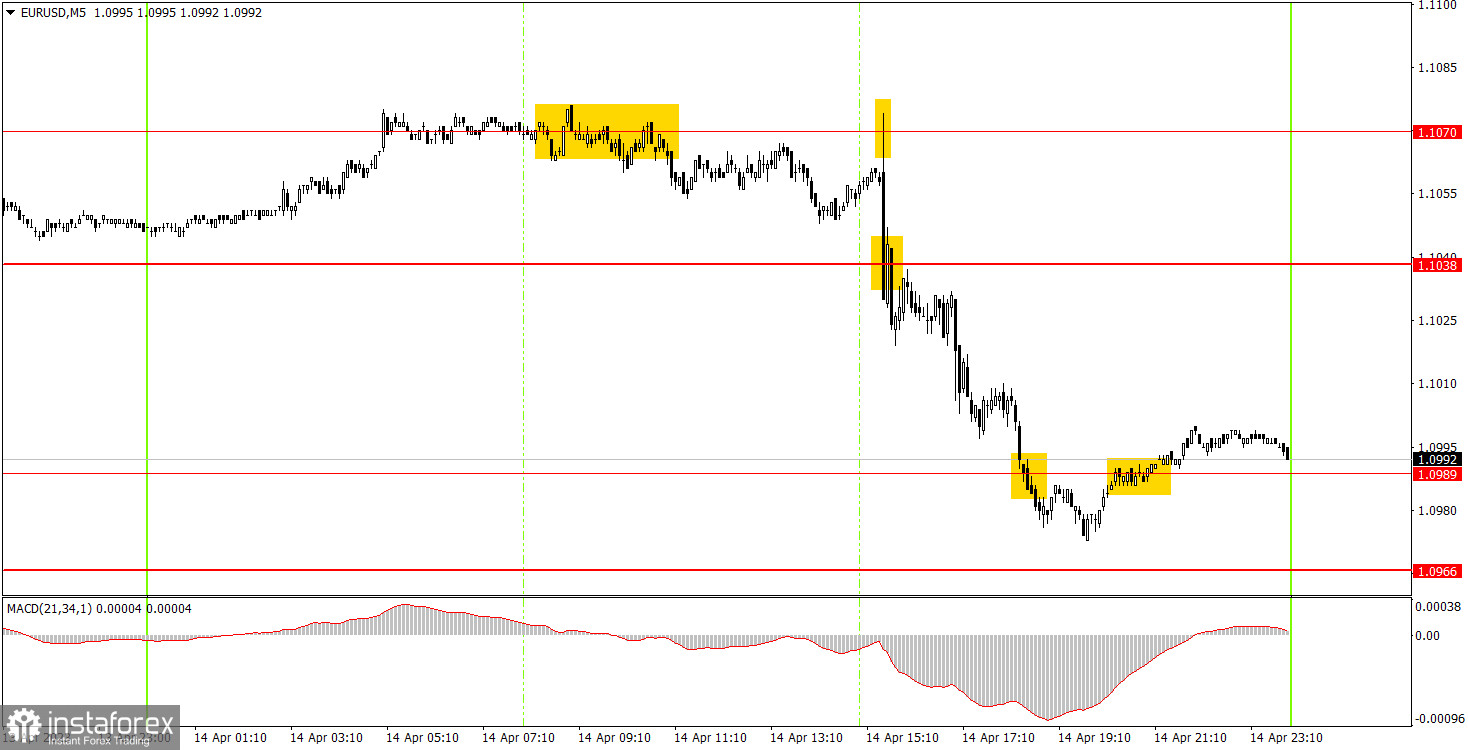
On the 5-minute chart, we can see that many trading signals were formed throughout the day, but only one should have worked out. The movement itself was quite volatile and there was a trend. First, the pair bounced twice from the 1.1070 level, and beginners could open one short position since the signals duplicated each other. Then the pair started to fall, and as a result it ended up below 1.0989. The short should have been manually closed either closer to the evening or once the pair consolidated above 1.0989. You could've earned at least 60 points on this, and there were no false signals during the day.
Trading tips on Monday:
On the 30-minute chart, the pair started to fall, which might be (like in the last couple of times) a pullback before the pair starts to continuously rise again. Unfortunately, the current situation does not allow us to be certain in which direction the pair will move in the coming week. The euro is overbought and should fall, but the market is still geared towards long positions, so the pair may grow again. On the 5-minute chart, it is recommended to trade at the levels 1.0792, 1.0857-1.0867, 1.0920-1.0933, 1.0966, 1.0989, 1.1038, 1.1070, 1.1132, 1.1184, 1.1228. As soon as the price passes 15 pips in the right direction, you should set a Stop Loss to breakeven. On Monday, no important events or reports are planned in the United States, and in the euro area, European Central Bank President Christine Lagarde will speak. Lagarde may touch on the topic of monetary policy, which will be interesting and important for the market.
Basic rules of the trading system:
1) The strength of the signal is determined by the time it took the signal to form (a rebound or a breakout of the level). The quicker it is formed, the stronger the signal is.
2) If two or more positions were opened near a certain level based on a false signal (which did not trigger a Take Profit or test the nearest target level), then all subsequent signals at this level should be ignored.
3) When trading flat, a pair can form multiple false signals or not form them at all. In any case, it is better to stop trading at the first sign of a flat movement.
4) Trades should be opened in the period between the start of the European session and the middle of the US trading hours when all positions must be closed manually.
5) You can trade using signals from the MACD indicator on the 30-minute time frame only amid strong volatility and a clear trend that should be confirmed by a trendline or a trend channel.
6) If two levels are located too close to each other (from 5 to 15 pips), they should be considered support and resistance levels.
On the chart:
Support and Resistance levels are the levels that serve as targets when buying or selling the pair. You can place Take Profit near these levels.
Red lines are channels or trend lines that display the current trend and show in which direction it is better to trade now.
The MACD indicator (14, 22, and 3) consists of a histogram and a signal line. When they cross, this is a signal to enter the market. It is recommended to use this indicator in combination with trend patterns (channels and trendlines).
Important announcements and economic reports that can be found on the economic calendar can seriously influence the trajectory of a currency pair. Therefore, at the time of their release, we recommend trading as carefully as possible or exiting the market in order to avoid sharp price fluctuations.
Beginners on Forex should remember that not every single trade has to be profitable. The development of a clear strategy and money management is the key to success in trading over a long period of time.


