


Analyzing Friday's trades:
GBP/USD on 30M chart
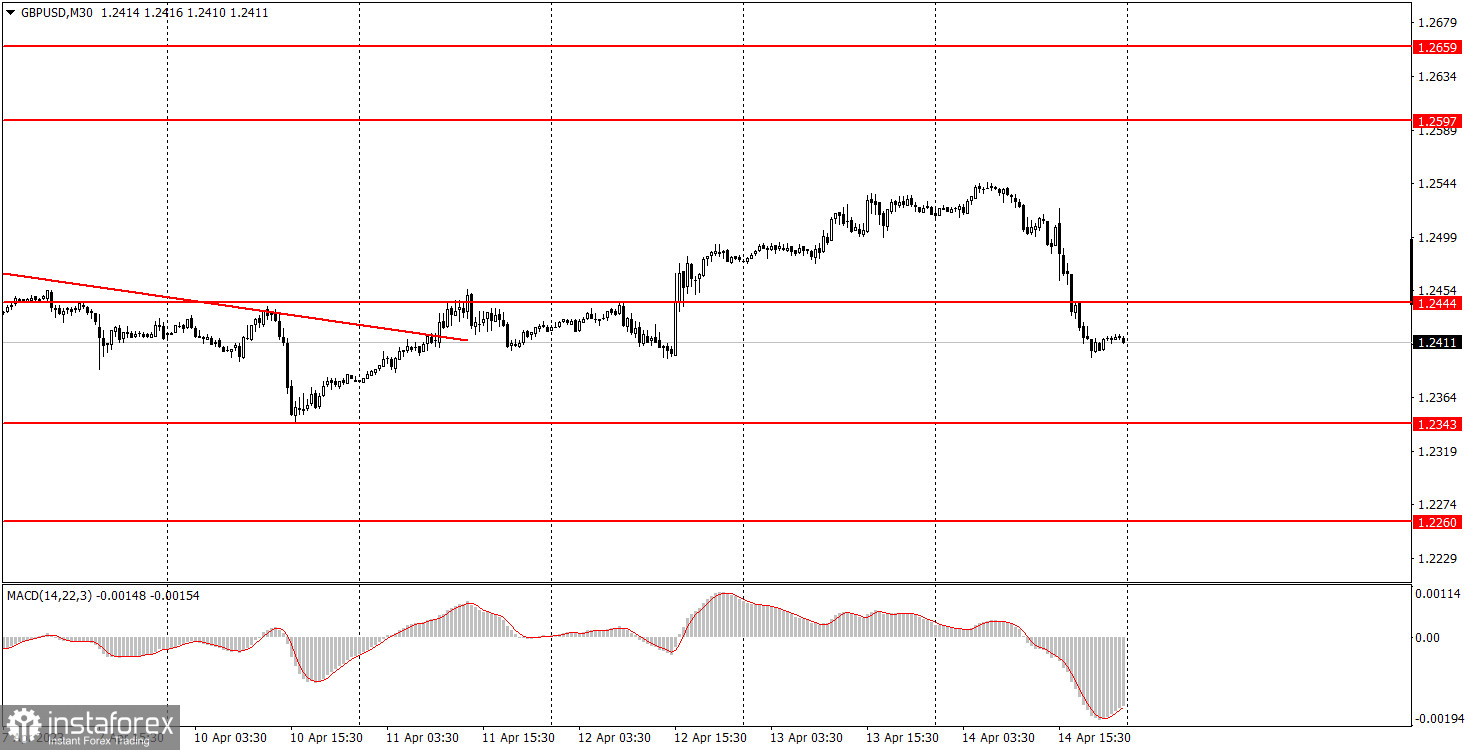
The GBP/USD pair also showed an impressive decline on Friday, approximately 150 points from the daily highs. As with the euro, there were no specific reasons for such a strong drop. The market is more uncertain than ever. For example, Friday's macro data could not provoke such a strong drop, but in addition to this, one of the members of the Federal Reserve's Monetary Committee, Christopher Waller, gave a speech and he hinted that the key interest rate may continue to rise. Recall that the market lowered the probability of a key rate hike in May after the inflation report recorded a 1% decline in March. However, as we can see, the Fed insists on being hawkish. And a bearish correction for the pound has been brewing for a couple of weeks. Therefore, the downward movement was both logical and illogical. I still expect the pound to fall, as all its growth in recent weeks has been illogical. But at the same time, everything will depend on the market. If it resumes baseless purchases, the pair will trade higher again.
GBP/USD on 5M chart
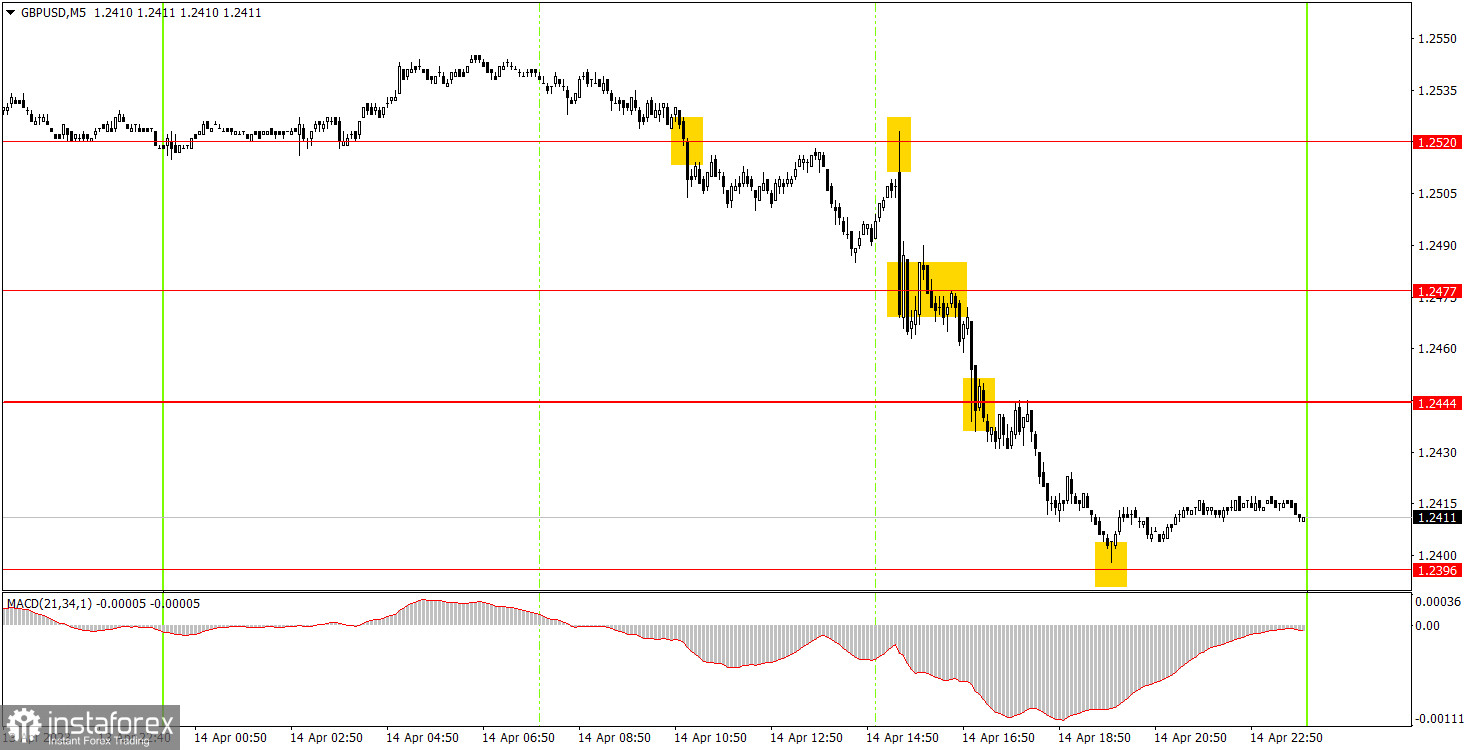
The trading signals on the 5-minute chart were quite good, because the overall movement was decent. In the first half of the day, there were two sell signals, but they weren't as good as the ones for the euro. Beginners could work on the first signal, but the short position was closed by Stop Loss at breakeven during the second bounce from 1.2520. And with the second signal around 1.2520, traders could only open new shorts after consolidating below the 1.2477 level. Nonetheless, the day still ended in good profit, because the pair managed to go down to the target level of 1.2396, from which it bounced. At this point, it was necessary to close short positions, with a profit of about 50 points.
Trading tips on Monday:
On the 30-minute chart, the GBP/USD pair entered a bearish correction, which can end very, very quickly. I believe that the pound should've fallen a long time ago, and there are many more reasons to back this up. However, the market insists on staying bullish, so the upward movement may continue next week as well. On the 5-minute chart, it is recommended to trade at the levels 1.2171-1.2179, 1.2245-1.2260, 1.2343-1.2360, 1.2396, 1.2444, 1.2477, 1.2520, 1.2577-1.2597-1.2616, 1.2659-1.2674. As soon as the price passes 20 pips in the right direction, you should set a Stop Loss to breakeven. On Monday, there are no important events or reports planned in the UK and the US. It's a good time to continue the correction.
Basic rules of the trading system:
1) The strength of the signal is determined by the time it took the signal to form (a rebound or a breakout of the level). The quicker it is formed, the stronger the signal is.
2) If two or more positions were opened near a certain level based on a false signal (which did not trigger a Take Profit or test the nearest target level), then all subsequent signals at this level should be ignored.
3) When trading flat, a pair can form multiple false signals or not form them at all. In any case, it is better to stop trading at the first sign of a flat movement.
4) Trades should be opened in the period between the start of the European session and the middle of the US trading hours when all positions must be closed manually.
5) You can trade using signals from the MACD indicator on the 30-minute time frame only amid strong volatility and a clear trend that should be confirmed by a trendline or a trend channel.
6) If two levels are located too close to each other (from 5 to 15 pips), they should be considered support and resistance levels.
On the chart:
Support and Resistance levels are the levels that serve as targets when buying or selling the pair. You can place Take Profit near these levels.
Red lines are channels or trend lines that display the current trend and show in which direction it is better to trade now.
The MACD indicator (14, 22, and 3) consists of a histogram and a signal line. When they cross, this is a signal to enter the market. It is recommended to use this indicator in combination with trend patterns (channels and trendlines).
Important announcements and economic reports that can be found on the economic calendar can seriously influence the trajectory of a currency pair. Therefore, at the time of their release, we recommend trading as carefully as possible or exiting the market in order to avoid sharp price fluctuations.
Beginners on Forex should remember that not every single trade has to be profitable. The development of a clear strategy and money management is the key to success in trading over a long period of time.


