


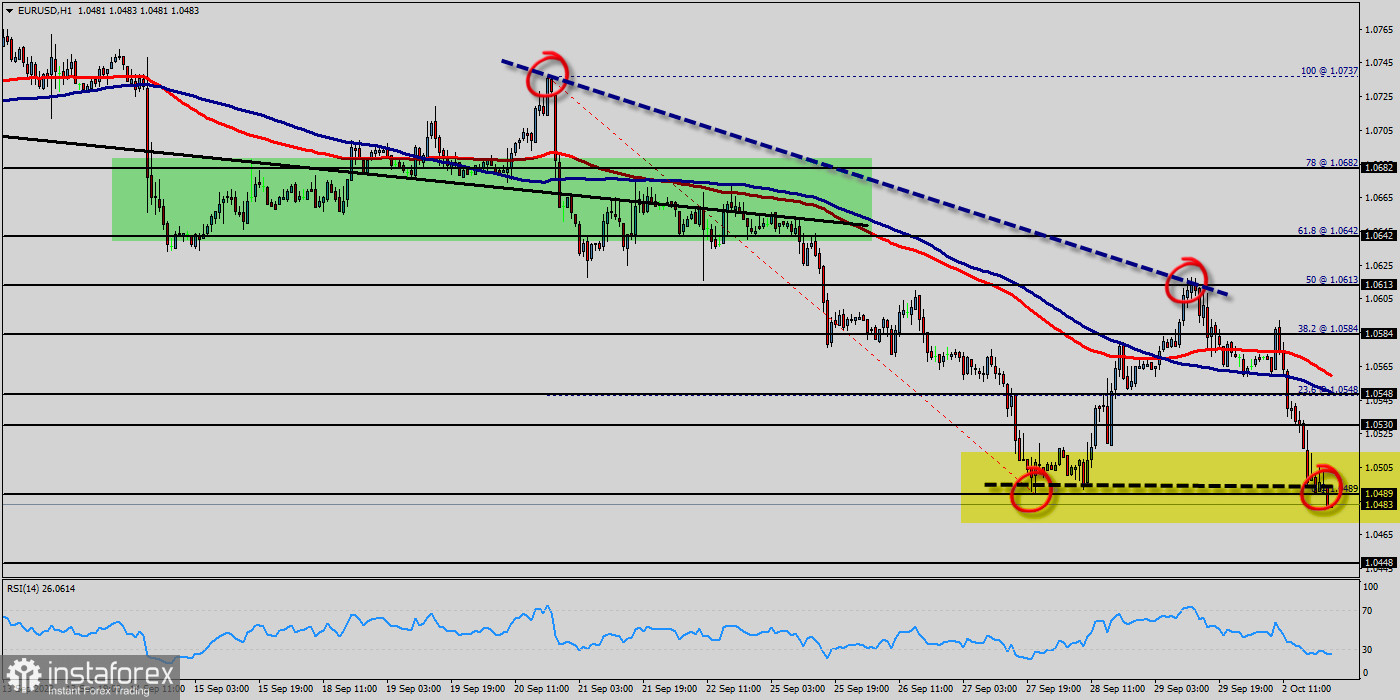
On the one-hour chart, the EUR/USD pair continues moving in a bearish trend from the resistance level of 1.0612. Currently, the price is in a bearish channel. This is confirmed by the RSI indicator signaling that we are still in a bullish trending market. Equally important, the RSI is still calling for a strong bearish market as well as the current price is also below the moving average 100.
As a result, sell below the weekly pivot point of 1.0642. The bias remains bearish in the nearest term testing 1.0563 and 1.0612. Immediate resistance is seen around 1.0642 levels, which coincides with the weekly pivot. Moreover, the moving average (100) starts signaling a downward trend; therefore, the market is indicating a bearish opportunity below 1.0612.
So it will be good to sell at 1.0612 with the first target of 1.0530. It will also call for a downtrend in order to continue towards 1.0503. The strong weekly support is seen at 1.0500. However, if a breakout happens at the resistance level of 1.0642, then this scenario may be invalidated.
Overall, we still prefer the bearish scenario which suggests that the pair will stay below the zone of 1.0642 this week. The EUR/USD pair continues to move upwards from the level of 1.0489. Today, the first support level is currently seen at 1.0489, the price is moving in a bullish channel now.
Furthermore, the price has been set above the strong support at the level of 1.0548, which coincides with the 23.6% Fibonacci retracement level. This support has been rejected three times confirming the veracity of an uptrend. According to the previous events, we expect the EUR/USD pair to trade between 1.0500 and 1.0680.
It should be noted that volatility is very high for that the EUR/USD pair is still moving between 1.0500 and 1.0680 in coming hours. This is confirmed by the RSI indicator signaling that we are still in the bullish trending market. Now, the pair is likely to begin an ascending movement to the point of 1.0500 and further to the level of 1.0680.
So, the support stands at1.0548, while daily resistance is found at 1.0680. Therefore, the market is likely to show signs of a bullish trend around the spot of 1.0548. In other words, buy orders are recommended above the spot of 1.0548 with the first target at the level of 1.0610; and continue towards 1.0680.
However, if the EUR/USD pair fails to break through the resistance level of 1.0530 today, the market will decline further to 1.0490. Finally, technical indicators remain within positive levels, with neutral-to-bullish slopes. The EUR/USD pair broke resistance which turned to strong support at the level of 1.0682 yesterday.
The level of 1.0682 coincides with 23.6% of Fibonacci, which is expected to act as major support today. Since the trend is above the 23.6% Fibonacci level, the market is still in an uptrend. From this point, the EUR/USD pair is continuing in a bullish trend from the new support of 1.0682.
Currently, the price is in a bullish channel. According to the previous events, we expect the EUR/USD pair to move between 1.0682 and 1.0789. On the H1 chart, resistance is seen at the levels of 1.0757 and 1.0789. Also, it should be noticed that, the level of 1.0734 represents the daily pivot point. Therefore, strong support will be formed at the level of 1.0682 providing a clear signal to buy with the targets seen at 1.0734.
If the trend breaks the support at 1.0734 (first resistance) the pair will move upwards continuing the development of the bullish trend to the level 1.0789 in order to test the daily resistance 2. However, stop loss is to be placed below the level of 1.0636 - last bearish wave. The EUR/USD pair continues to move upwards from the level of 1.0687. The pair rose from the level of 1.0687 (last bearish wave) to a top around 1.0754.
Today, the first support level is seen at 1.0687 followed by 1.0600, while daily resistance 1 is seen at 1.0785. According to the previous events, the EUR/USD pair is still moving between the levels of 1.0687 and 1.0785; for that we expect a range of 98pips (1.0785 - 1.0687). On the one-hour chart, immediate resistance is seen at 1.0785, which coincides with a ratio of 50% Fibonacci retracement - the first bullish wave.
Currently, the price is moving in a bullish channel. This is confirmed by the RSI indicator signaling that we are still in a bullish trending market. The price is still above the moving average (100) and (50). Therefore, if the trend is able to break out through the first resistance level of 1.0785, we should see the pair climbing towards the daily resistance at 1.0808 to test it. It would also be wise to consider where to place stop loss; this should be set below the second support of 1.0687.


