


Trend analysis:
Further decline may be seen in GBP/USD in October, starting from the closing of the September monthly candle at 1.2195 to the 38.2% retracement level of 1.2070 (yellow dashed line). Upon testing this level, the pair will move to the historical resistance level of 1.2650 (blue dashed line). The upward movement may continue after reaching the level.
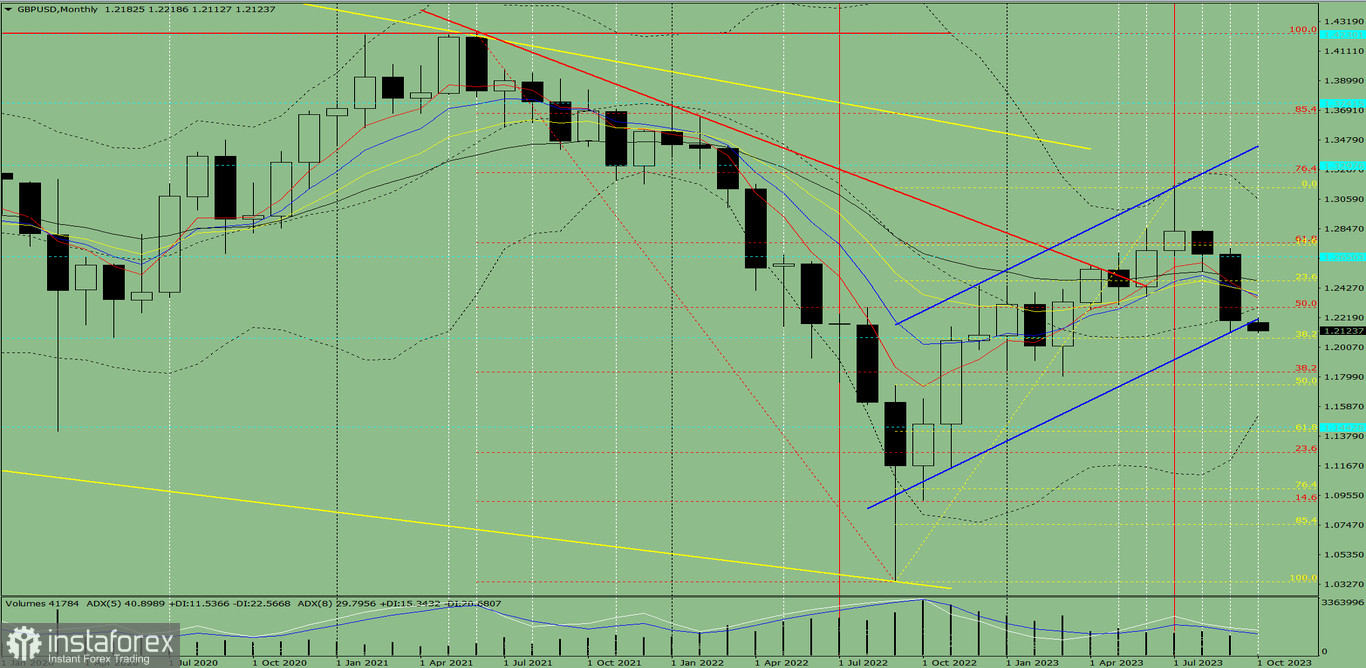
Fig. 1 (monthly chart)
Comprehensive analysis:
Indicator analysis - downtrend
Fibonacci levels - downtrend
Volumes - downtrend
Candlestick analysis - uptrend
Trend analysis - uptrend
Bollinger bands - downtrend
Conclusion: All signals point to a downward movement in GBP/USD.
Overall conclusion: The pair will have a bearish trend, with no first upper shadow on the monthly black candle (first week of month - black) and a second lower shadow (last week - white).
Therefore, for this month, pound will rise from 1.2195 (closing of the September monthly candle) to the 38.2% retracement level of 1.2070 (yellow dashed line). It will be followed by a move to the historical resistance level of 1.2650 (blue dashed line) and a potential upward movement after reaching the level.
Alternatively, the pair could fall from 1.2195 (closing of the September monthly candle) to the 38.2% retracement level of 1.2070 (red dashed line), and then rise to the 50.0% retracement level of 1.2289 (red dashed line).


