


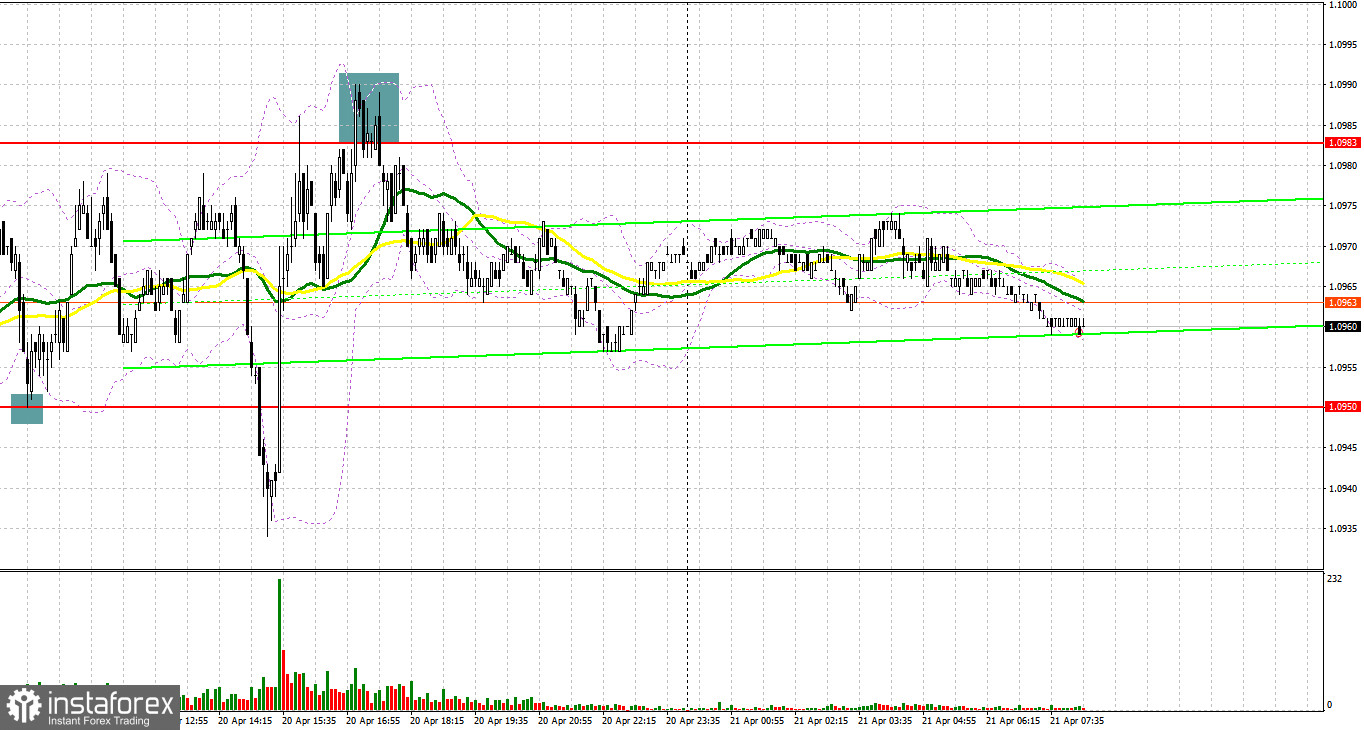
Yesterday, the pair formed several entry signals. Let's have a look at the 5-minute chart and see what happened there. In my morning forecast, I mentioned the level of 1.0950 with recommendations to make your market entry decisions from there. A decline and a false breakout at this level generated a buy signal which sent the euro up by about 20 pips. Yet, the price failed to reach the nearest resistance at 1.0983. In the second half of the day, strong selling activity at 1.0983 created a sell signal, which resulted in the pair's downward movement by approximately 20 pips.
To open long positions on EUR/USD:
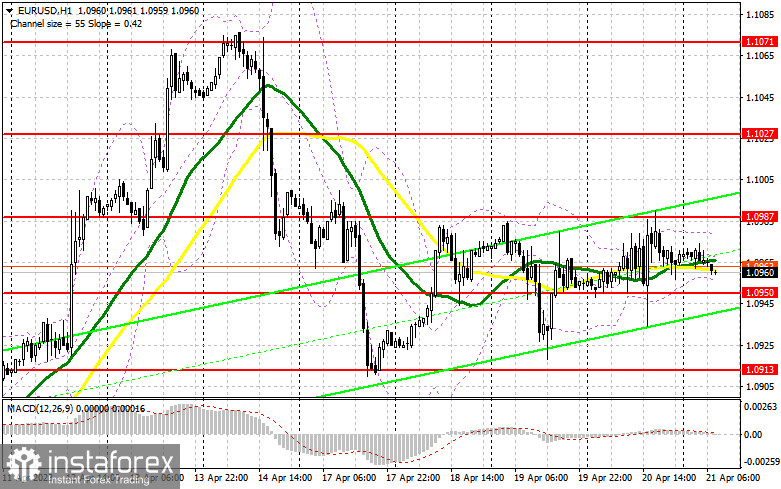
The pair remains in the channel, but today, bears have a chance to break below with the nearest support at 1.0950 which is still a strong obstacle for them. For the same reason, bulls need to be as active as possible when the pair declines to that level. This would be possible only in the case of the positive US PMI data for April. If the index reveals growing activity in the manufacturing and private sectors, bulls will still have a chance to develop an uptrend. The formation of a false breakout at the 1.0950 level, similar to the one discussed earlier, will lead to a buy signal and a rise towards the nearest resistance at 1.0987 formed yesterday. A breakout and a downward test of this range will strengthen the bullish bias and create an additional entry point for adding long positions, with the next upward target at the resistance of 1.1027. The 1.1071 area remains the highest target where I will be taking profit. If EUR/USD declines and buyers are idle at 1.0950, which is quite likely given the multiple tests of this level yesterday, pressure on the euro will increase. Only the formation of a false breakout around the lower boundary at 1.0913 will provide a buy signal for the euro. I will open long positions immediately on a rebound from the low of 1.0867, keeping in mind an upward intraday correction of 30-35 pips.
To open short positions on EUR/USD:
Sellers tried to take control of the market yesterday but were not particularly successful. Today, the important task for them is to maintain control of the 1.0987 resistance level. A negative reaction to eurozone business activity data and a false breakout at this level will provide a sell signal. If so, the pair may return to 1.0950. The moving averages supporting the buyers are located slightly above this level, so bears may face difficulties there. Consolidation below this range and its upward retest will pave the way to 1.0913. The ultimate target is the new weekly low of 1.0867 where I will be taking profit. If EUR/USD moves up during the European session and bears are idle at 1.0987, which is also likely, it is advised to postpone short positions until the 1.1027 level. You can go short at this point but only after a failed attempt of consolidation. I will open short positions immediately on a rebound from the high of 1.1071, aiming for a downward correction of 30-35 pips.
COT report:
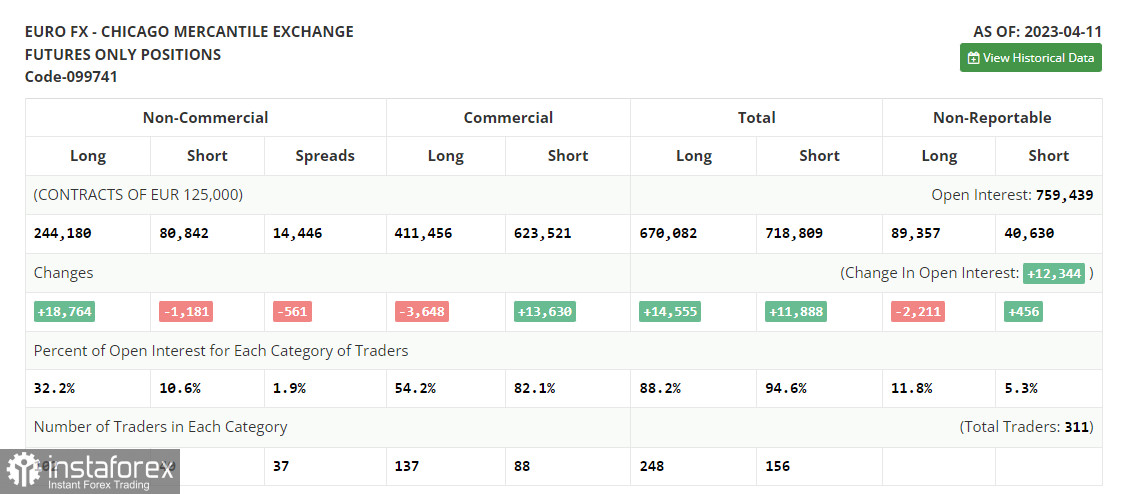
The Commitments of Traders report for April 11 recorded a rise in long positions and a drop in short ones. Recent US statistics signal a gradual overheating of the labor market, as well as a reduction in retail sales, which will definitely have a positive effect on inflationary pressures in the US. This may allow the Federal Reserve to stop its tightening cycle. But according to the minutes of the last meeting, Fed officials do not intend to do this right now. Most likely, we will see another rate hike of 0.25% in May this year. If so, the US dollar will maintain its leading position against the euro, trading below 1.1000. There is no crucial data this week apart from business activity in the private and industrial sectors. So, the euro sellers will have every chance for a continuation of the downward correction. The COT report indicates that long non-commercial positions increased by 18,764 to 244,180, while short non-commercial positions decreased by 1,181 to 80,842. At the end of the week, the total non-commercial net position fell to 162,496 from 143,393 The weekly closing price declined to 1.0950 from 1.1.
Indicator signals:
Moving Averages
Trading near the 30- and 50-day moving averages indicates a range-bound market.
Please note that the time period and levels of the moving averages are analyzed only for the H1 chart, which differs from the general definition of the classic daily moving averages on the D1 chart.
Bollinger Bands
If the pair declines, the lower band of the indicator at 1.0950 will serve as support.
Description of indicators:
• A moving average of a 50-day period determines the current trend by smoothing volatility and noise; marked in yellow on the chart;
• A moving average of a 30-day period determines the current trend by smoothing volatility and noise; marked in green on the chart;
• MACD Indicator (Moving Average Convergence/Divergence) Fast EMA with a 12-day period; Slow EMA with a 26-day period. SMA with a 9-day period;
• Bollinger Bands: 20-day period;
• Non-commercial traders are speculators such as individual traders, hedge funds, and large institutions who use the futures market for speculative purposes and meet certain requirements;
• Long non-commercial positions represent the total number of long positions opened by non-commercial traders;
• Short non-commercial positions represent the total number of short positions opened by non-commercial traders;
• The non-commercial net position is the difference between short and long positions of non-commercial traders.


