


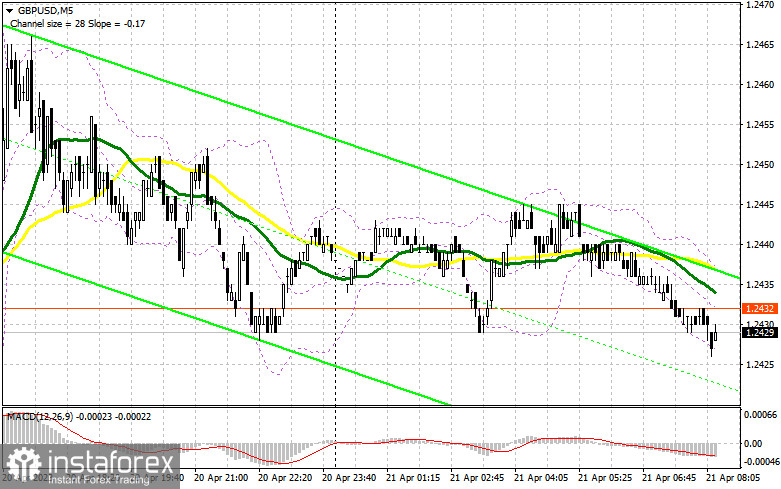
Yesterday, a single market entry signal was formed. Let's take a look at the 5-minute chart and figure out what happened. In my morning forecast, I considered entering the market from the level of 1.2434. A breakout and retest of this level to the downside produced a signal to buy the pound. However, it was a false signal, so I had to take losses. No entry points were created in the second half of the day.
To open long positions on GBP/USD:
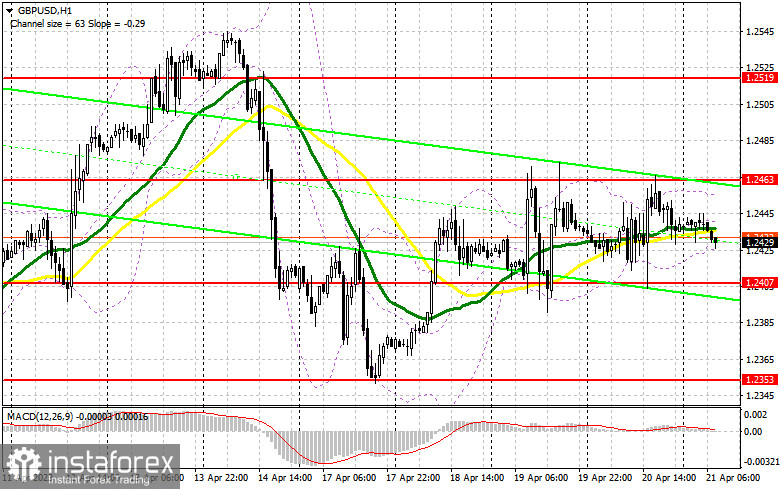
Today, the market will focus on UK retail sales data and business activity in the manufacturing and service sectors. The pound will face pressure if these reports come weak. In such a case, bullish activity may increase in the area of the nearest support at 1.2407, formed yesterday. A false breakout there will create a buy entry point with the target at 1.2463, the upper limit of the channel. This is an important level where the uptrend may resume. A breakout and consolidation above this range will make an additional buy signal, targeting 1.2519. The most distant target will stand at 1.2561, but the price will unlikely reach it in the first half of the day. I will take profits there. If there is a decline to the area of 1.2407 and a lack of bullish activity, I will open long positions only after a false breakout through the next support at 1.2353. I plan to buy GBP/USD immediately on a rebound only from a low of 1.2310, allowing a correction of 30-35 pips intraday.
To open short positions on GBP/USD:
Sellers should protect the area of 1.2463. Otherwise, buyers will regain control over the market and attempt to test weekly highs and maintain the uptrend. If bulls fail to break above 1.2463 in the wake of weak UK statistics and a false breakout occurs, the pound will face pressure. In such a case, the price may test the level of 1.2407, the lower limit of the sideways channel. A breakout and an upside retest of this range will cause an increase in pressure on the pound. A sell signal will be made, targeting 1.2353. The most distant target remains at a low of 1.2310, where I will take profits. In the case of growth in GBP/USD and a lack of activity at 1.2463, I will open short positions after a test of the next resistance at 1.2519. Only a false breakout there will create a buy entry point. If no downward movement follows, I will sell GBP/USD on a rebound immediately from a high of 1.2519, allowing a bearish correction of 30-35 pips intraday.
Indicator signals:
Moving averages
Trading is carried out in the area of the 30-day and 50-day moving averages, which indicates a sideways trend.
Note: The period and prices of moving averages are viewed by the author on the hourly chart and differ from the general definition of classic daily moving averages on the daily chart.
Bollinger Bands
Support stands at 1.2425, in line with the lower band.
Indicator description:
- Moving average (MA) determines the current trend by smoothing volatility and noise. Period 50. Colored yellow on the chart.
- Moving average (MA) determines the current trend by smoothing volatility and noise. Period 30. Colored green on the chart.
- Moving Average Convergence/Divergence (MACD). Fast EMA 12. Slow EMA 26. SMA 9.
- Bollinger Bands. Period 20
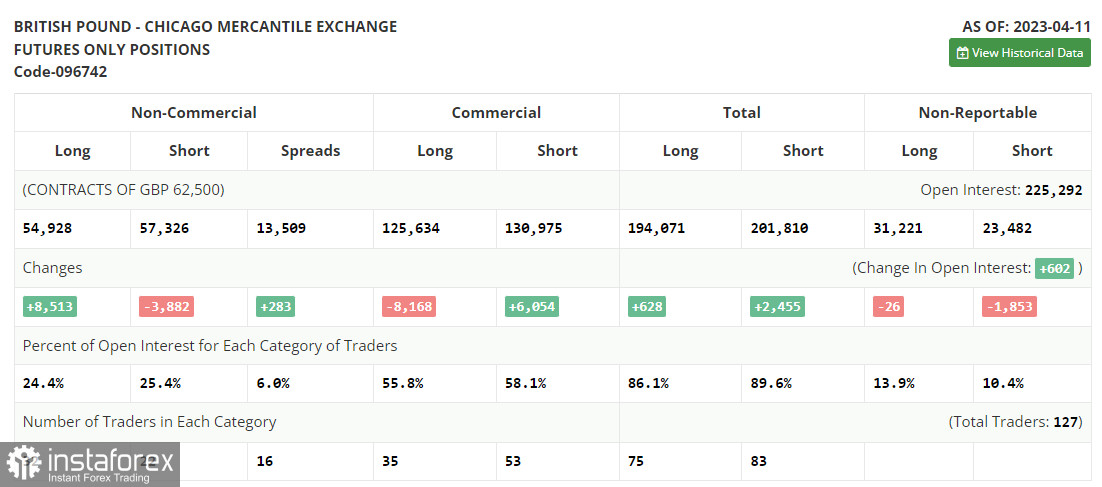
- Non-commercial traders are speculators such as individual traders, hedge funds, and large institutions who use the futures market for speculative purposes and meet certain requirements.
- Long non-commercial positions are the total long position of non-commercial traders.
- Non-commercial short positions are the total short position of non-commercial traders.
- Total non-commercial net position is the difference between the short and long positions of non-commercial traders.


