


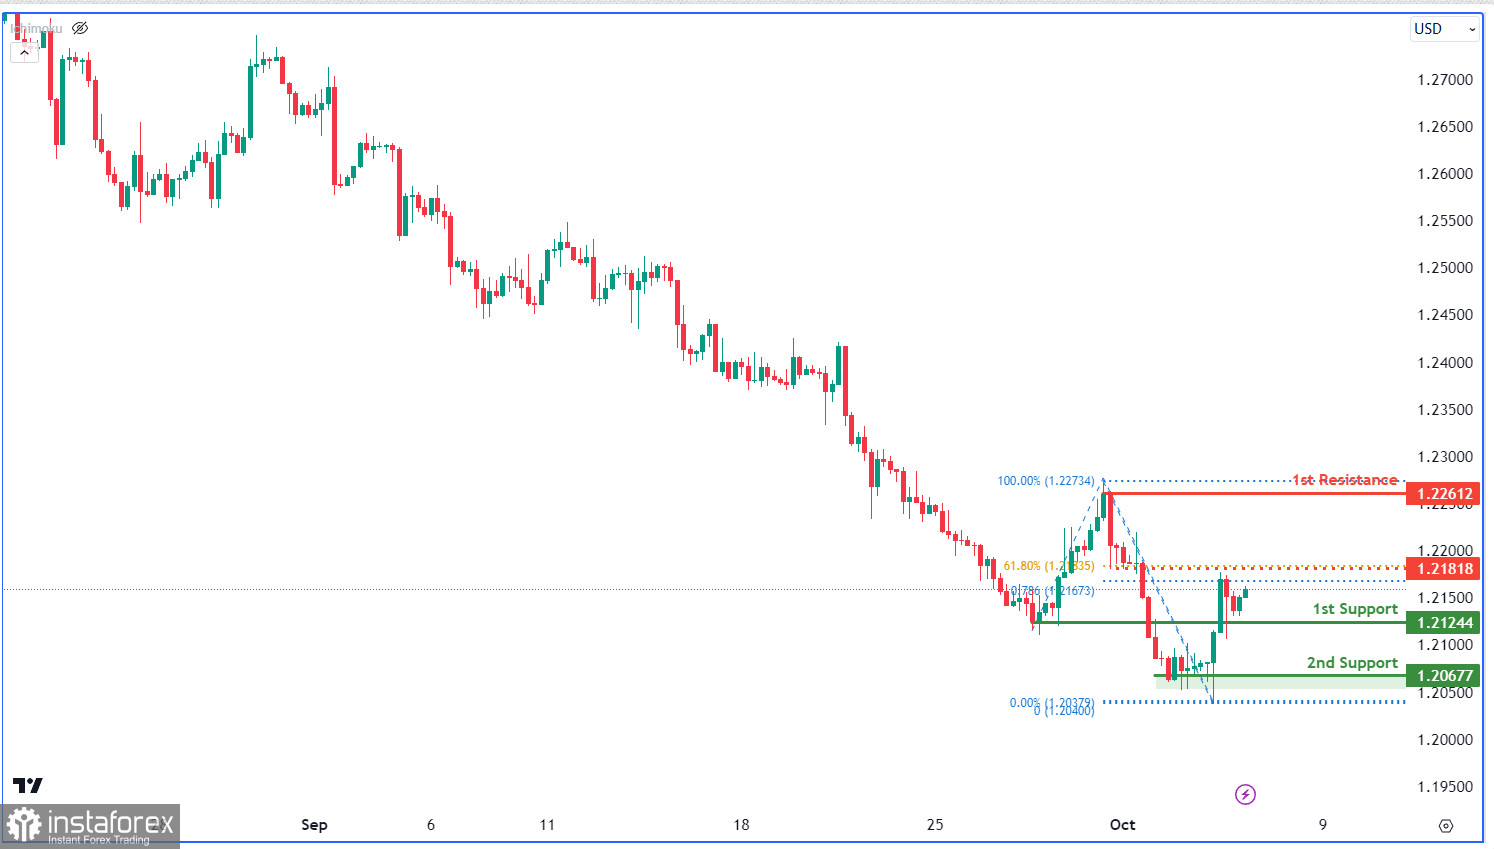
The GBP/USD chart has a bullish momentum with a potential move towards the 1st resistance at 1.2261, a swing high resistance. On the support side, the 1st support at 1.2124 is an overlap support, and the 2nd support at 1.2067 is a multi-swing low support. An intermediate resistance at 1.2181 with the 61.80% Fibonacci Retracement may influence price.


