


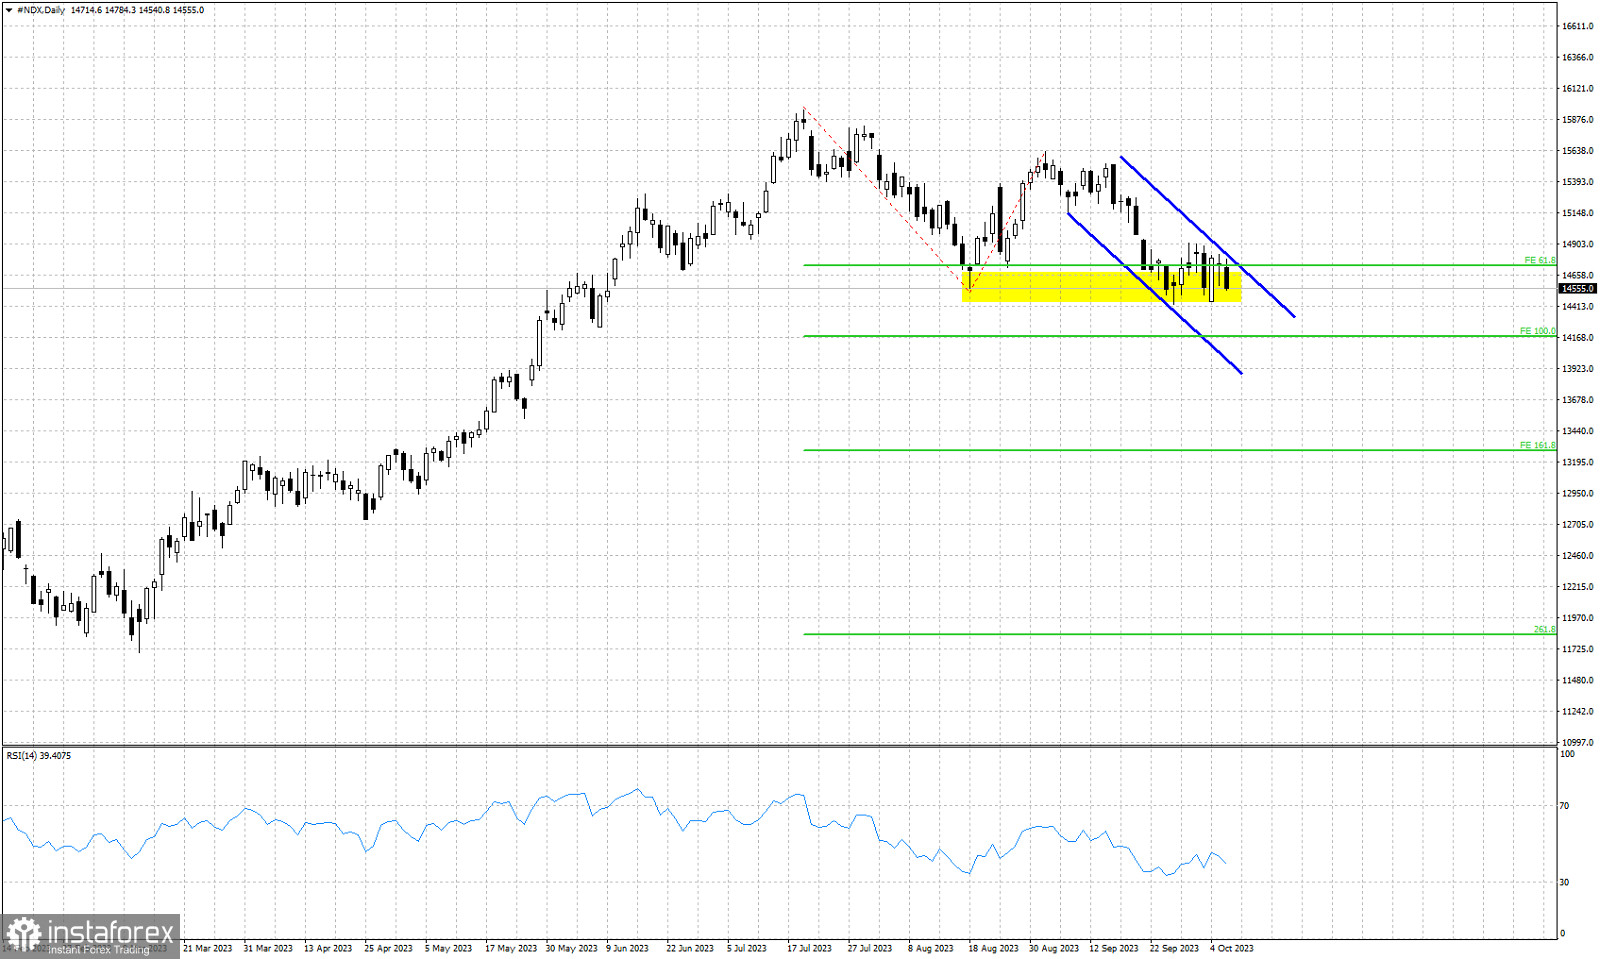
Green lines- Fibonacci extension targets
Yellow rectangle- support
Blue lines- bearish channel
NASDAQ is trading around 14,585. Price has made no real progress over the last 8 trading sessions. Price continues to move sideways around 14,620. Taking a wider look at the chart we see the lower high that was formed in August and the price currently on the brink of breaking to new lower lows. In the near term a downward sloping channel has been formed and price is challenging the horizontal support area marked with yellow in the accompanying chart. Our target is the 100% Fibonacci extension target at 14,180. Short-term trend remains bearish as long as price is trading inside the blue channel.


