


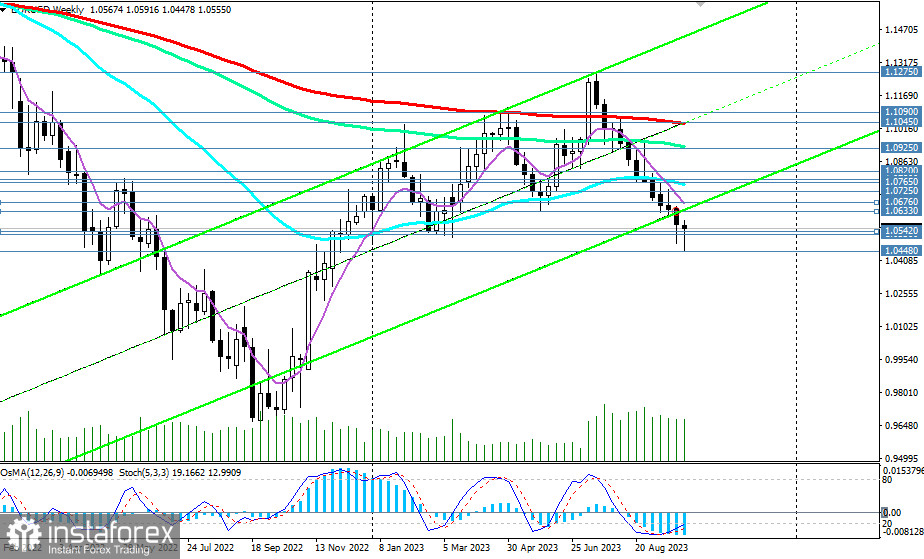
Even before last Wednesday, the EUR/USD pair had been declining for 11 consecutive weeks, delving into the territory of medium-term and long-term bear markets, respectively, below the key resistance levels of 1.0765 (200 EMA on the daily chart) and 1.1045 (200 EMA on the weekly chart).
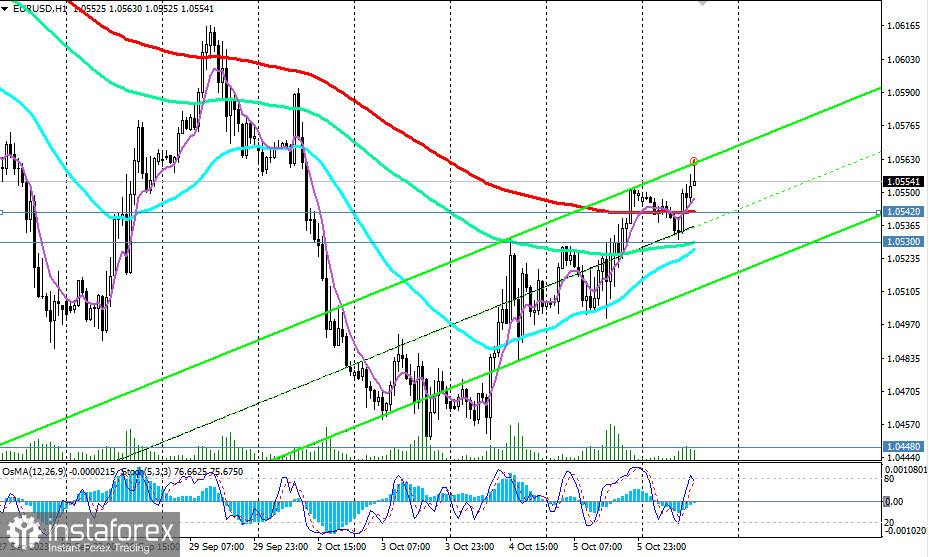
However, on Wednesday, the pair's direction shifted to the opposite, and after breaking through the important short-term resistance level of 1.0542 (200 EMA on the 1-hour chart), EUR/USD entered the zone of the short-term bull market.
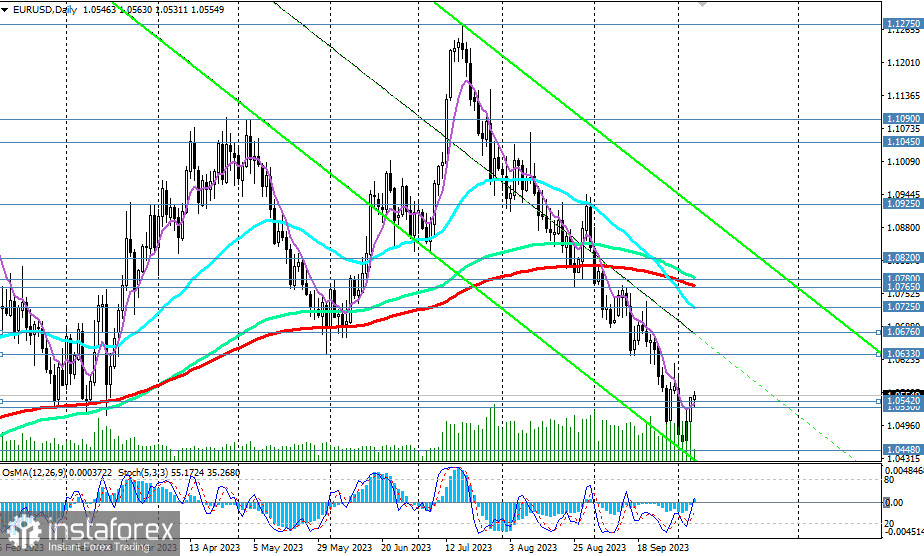
For now, this movement can be considered a correction after a significant decline, but if the upward correction continues, the targets at levels 1.0633 (144 EMA on the 4-hour chart) and 1.0676 (200 EMA on the 4-hour chart) could become quite achievable.
Considering the overall downward dynamics of the pair and the strength of the dollar, further growth currently seems unlikely.
In the case of a strong U.S. Labor Department report today, one should expect a resumption of the decline, and the signal for new short positions will be the break of support levels at 1.0542 and 1.0530 (144 EMA on the 1-hour chart).
The nearest targets are the local low of 1.0448 and the level of 1.0400, below which the lower boundary of the downward channel on the daily chart passes.
In an alternative scenario, weak NFP data will give the EUR/USD pair a new bullish impulse, with the targets being resistance levels of 1.0633 and 1.0676.
In the case of further growth and after breaking through the resistance zone at levels 1.0765 (200 EMA on the daily chart) and 1.0780 (144 EMA on the daily chart), EUR/USD will return to the medium-term bull market zone.
However, only a break above the important long-term resistance levels at 1.1045 (200 EMA on the weekly chart and 50 EMA on the monthly chart) will confirm the resumption of the long-term upward trend, with the nearest targets near the resistance levels of 1.1275 (local resistance level), 1.1300 (upper boundary of the upward channel on the weekly chart), and further targets near the resistance level of 1.1600 (200 EMA on the monthly chart).
Rising above the level of 1.1600 will indicate the return of EUR/USD to the global bull market zone.
Support levels: 1.0542, 1.0530, 1.0500, 1.0448, 1.0400
Resistance levels: 1.0633, 1.0676, 1.0700, 1.0720, 1.0765, 1.0780, 1.0800, 1.0820, 1.0900, 1.0925, 1.1000, 1.1045, 1.1090, 1.1200, 1.1275, 1.1300, 1.1400, 1.1500, 1.1600


