Details of the economic calendar on May 12
The first estimate of the UK's GDP for the first quarter came in below forecasts, indicating a slowdown in economic growth from 0.6% to 0.2%. The economy was expected to slow down to 0.3%, increasing the risk of falling into a recession.
As a result of the negative GDP estimate for the first quarter, the British pound accelerated its decline.
Analysis of trading charts from May 12
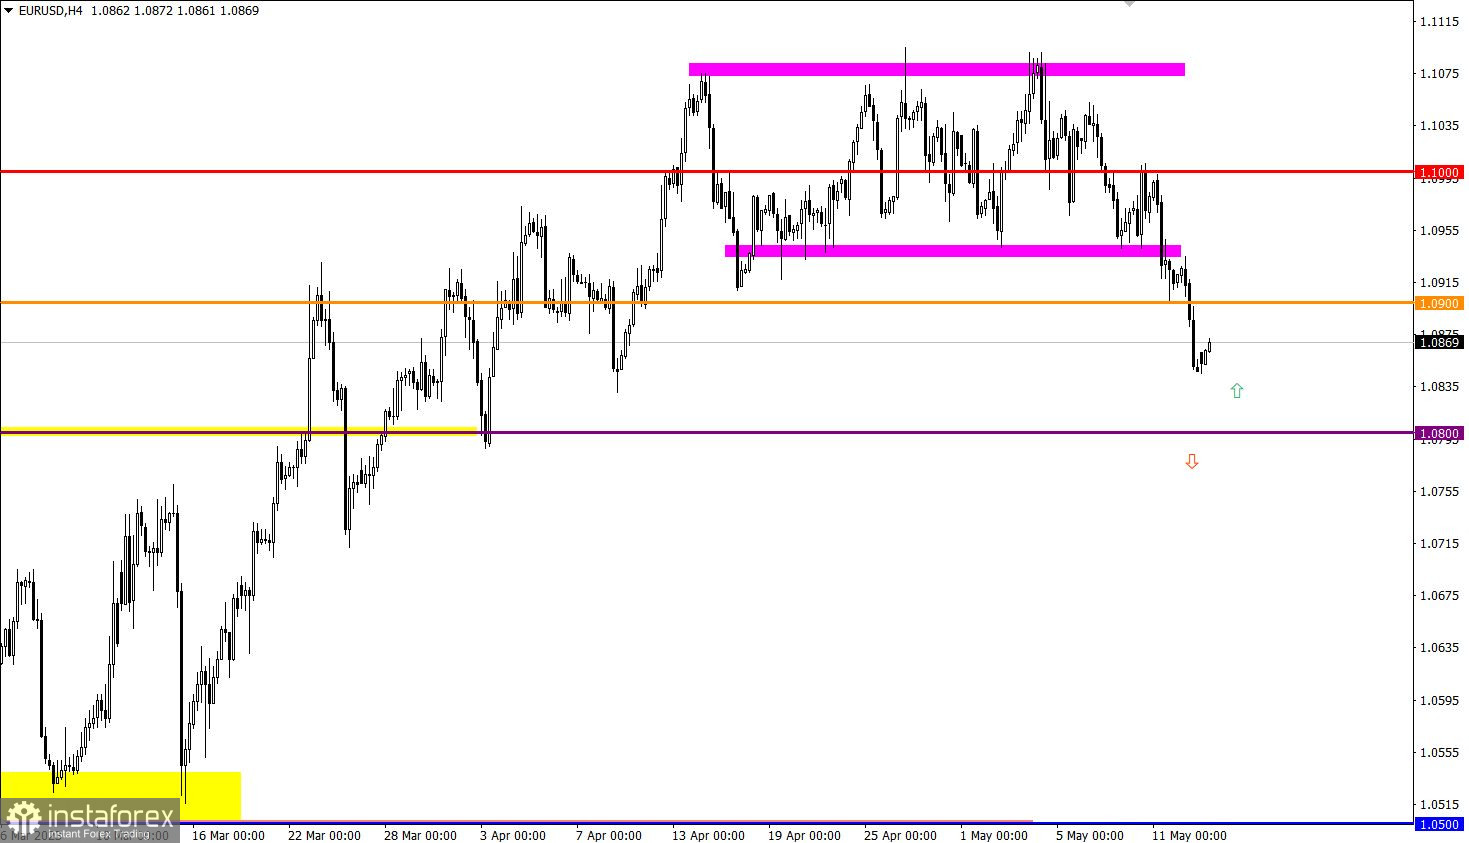
EUR/USD fell temporarily below the 1.0850 level during an intense downward movement, which led to a technical signal of its oversold. The total volume of the euro's decline last week was about 180 points.
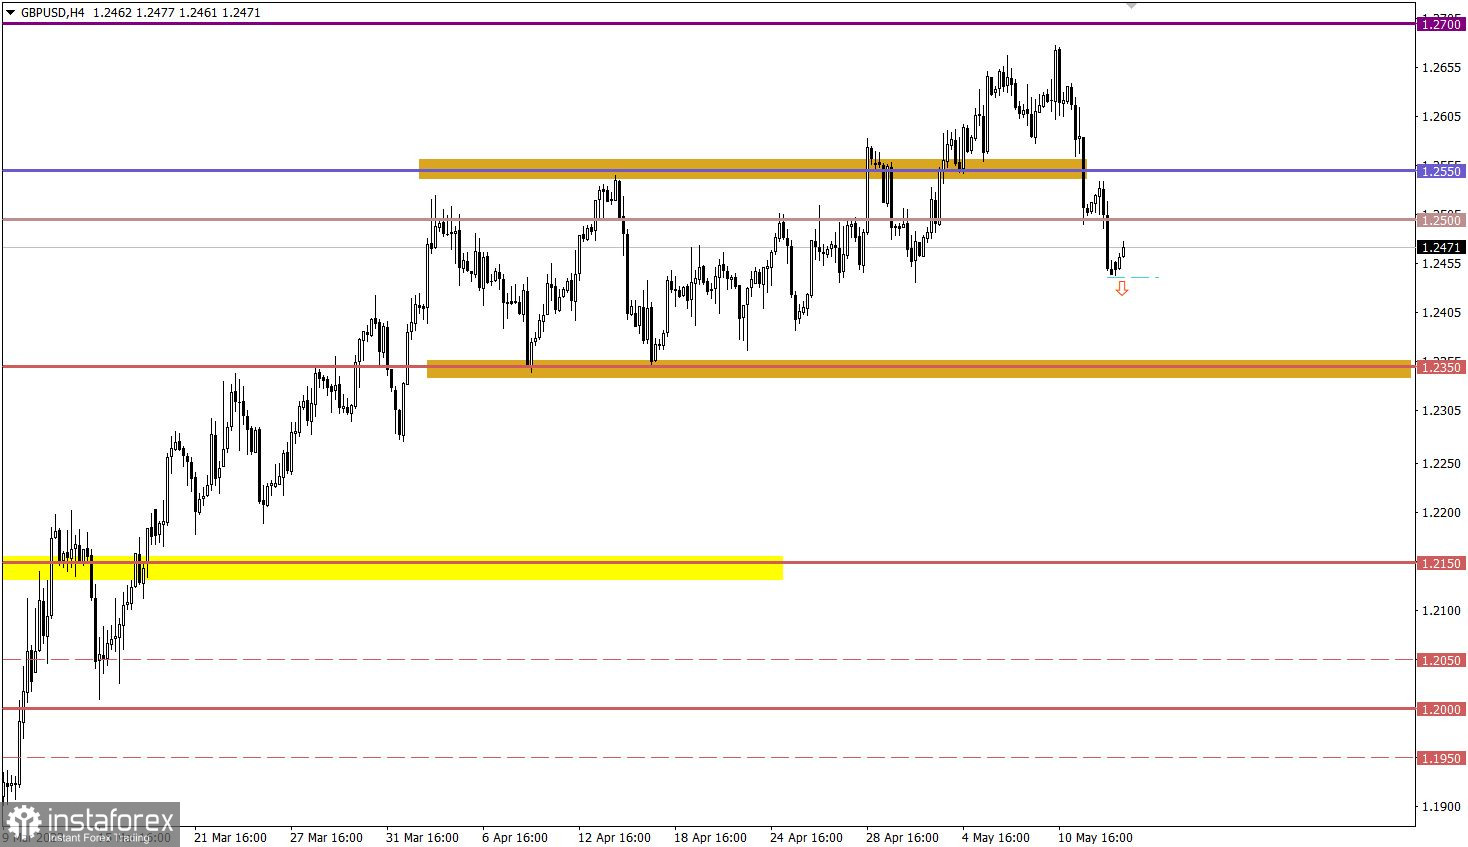
GBP/USD lost approximately 200 points in value last week. This inertial movement led to a full correction in the structure of the medium-term upward trend in the market.

Economic calendar for May 15
Today, data on industrial production in the European Union is expected to be published, where a slowdown in growth is expected from 2.0% to 1.1%. This is a negative factor for the EU economy, and if the data is confirmed, it may lead to a further weakening of the euro's rate.
Time targeting:
EU Industrial Production – 09:00 UTC
EUR/USD trading plan for May 15
The market is still experiencing a corrective movement from the peak of the medium-term trend, but the oversold signal of the euro may indicate its end. Traders consider the 1.0800/1.0850 values as a support area, relative to which the volume of short positions may decrease. In this case, stagnation may occur, followed by a reversal.
As for the downward scenario, traders consider it as an inertial movement, and if the price is stably held below the 1.0800 level, further decline is possible.

GBP/USD trading plan for May 15
In this situation, there is a technical signal of an oversold British pound in the intraday period. This may indicate a slowdown and, as a result, the end of the corrective movement. However, given the inertial course, there is a possibility that the technical signal of oversold pound will be ignored by speculators. In this case, holding the price below the 1.2440 level may lead to a decrease towards the 1.2350 level.

What's on the charts
The candlestick chart type is white and black graphic rectangles with lines above and below. With a detailed analysis of each individual candle, you can see its characteristics relative to a particular time frame: opening price, closing price, intraday high and low.
Horizontal levels are price coordinates, relative to which a price may stop or reverse its trajectory. In the market, these levels are called support and resistance.
Circles and rectangles are highlighted examples where the price reversed in history. This color highlighting indicates horizontal lines that may put pressure on the asset's price in the future.
The up/down arrows are landmarks of the possible price direction in the future.


