


Trend analysis (Fig. 1).
The market may move downward from the level of 1.0802 (closing of Friday's daily candle) with the target of 1.0760, the lower fractal (red dotted line). When testing this level, the price may continue to move downward with the target of 1.0737, the 61.8% pullback level (yellow dotted line).
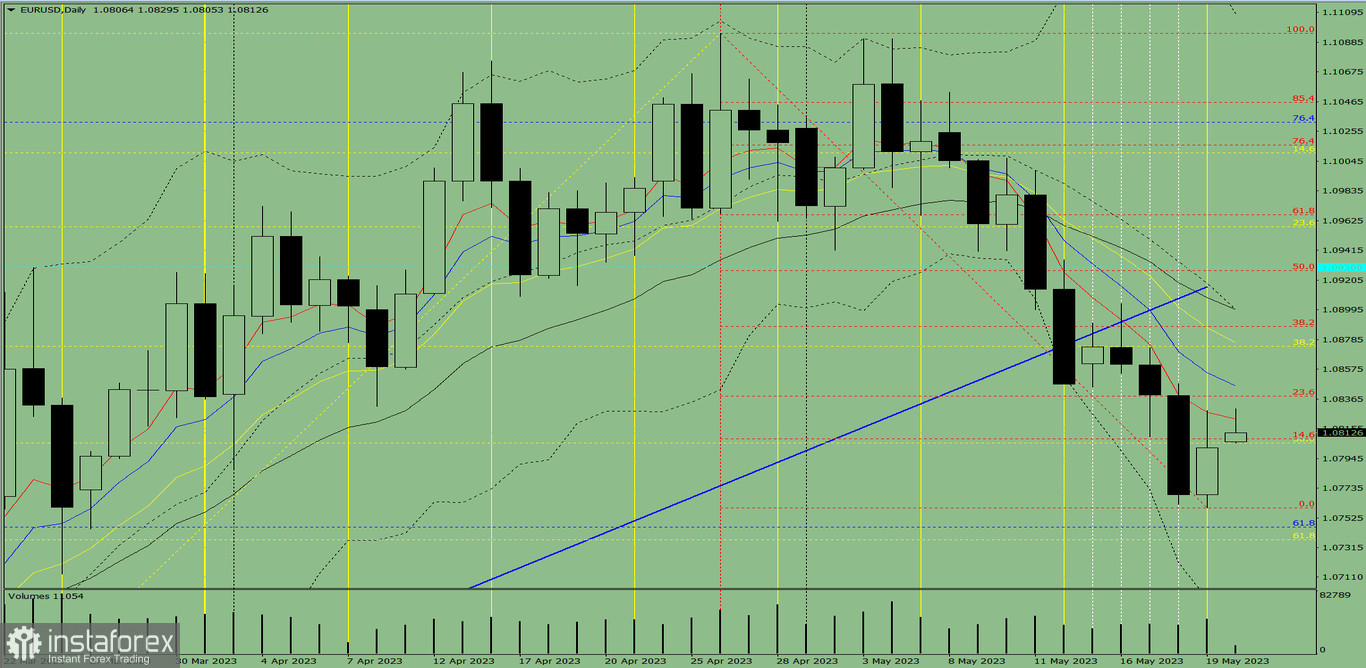
Fig. 1 (daily chart).
Comprehensive analysis:
- Indicator analysis - down;
- Fibonacci levels - down;
- Volumes - up;
- Candlestick analysis - down;
- Trend analysis - down;
- Bollinger bands - down;
- Weekly chart - down.
General conclusion:
Today, the price may move downward from the level of 1.0802 (closing of Friday's daily candle) with the target of 1.0760, the lower fractal (red dotted line). When testing this level, the price may continue to move downward with the target of 1.0737, the 61.8% pullback level (yellow dotted line).
Alternatively, the price may move downward from the level of 1.0802 (closing of Friday's daily candle) with the target of 1.0737, the 61.8% pullback level (yellow dotted line). When testing this level, an upward movement is possible with the target of 1.0760, the upper fractal (yellow dotted line).


