


Trend analysis
EUR/USD may continue declining from 1.0802 (closing of the last weekly candle) to 1.0652, which is a 76.4% retracement level (blue dashed line). Upon reaching this price, the pair will bounce up to 1.0883, which is a historical resistance level (blue dashed line).
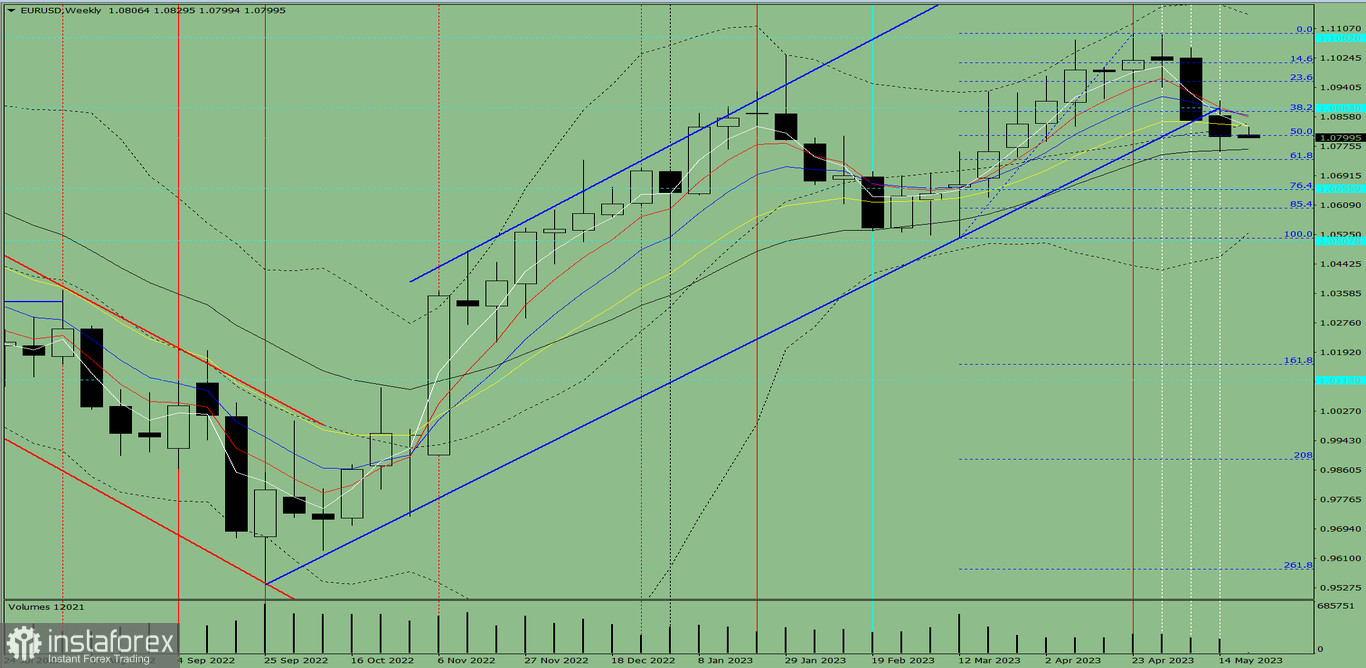
Fig. 1 (weekly chart)
Comprehensive analysis:
Indicator analysis - downward
Fibonacci levels - downward
Volumes - downward
Candlestick analysis - upward
Trend analysis - downward
Bollinger bands - upward
Monthly chart - downward
All this points to a downward movement in EUR/USD.
Conclusion: Most likely, the pair will have a bearish trend, with no first upper shadow on the weekly black candle (Monday - downward) and no second lower shadow (Friday - downward).
So during the week, euro will fall from 1.0802 (closing of the last weekly candle) to the 76.4% retracement level at 1.0652 (blue dashed line), and then climb up to the historical resistance level at 1.0883 (blue dashed line).
Alternatively, the quote may go down from 1.0802 (closing of the last weekly candle) to the 61.8% retracement level at 1.0737 (blue dashed line), and then rebound to the historical resistance level at 1.0883 (blue dashed line).


