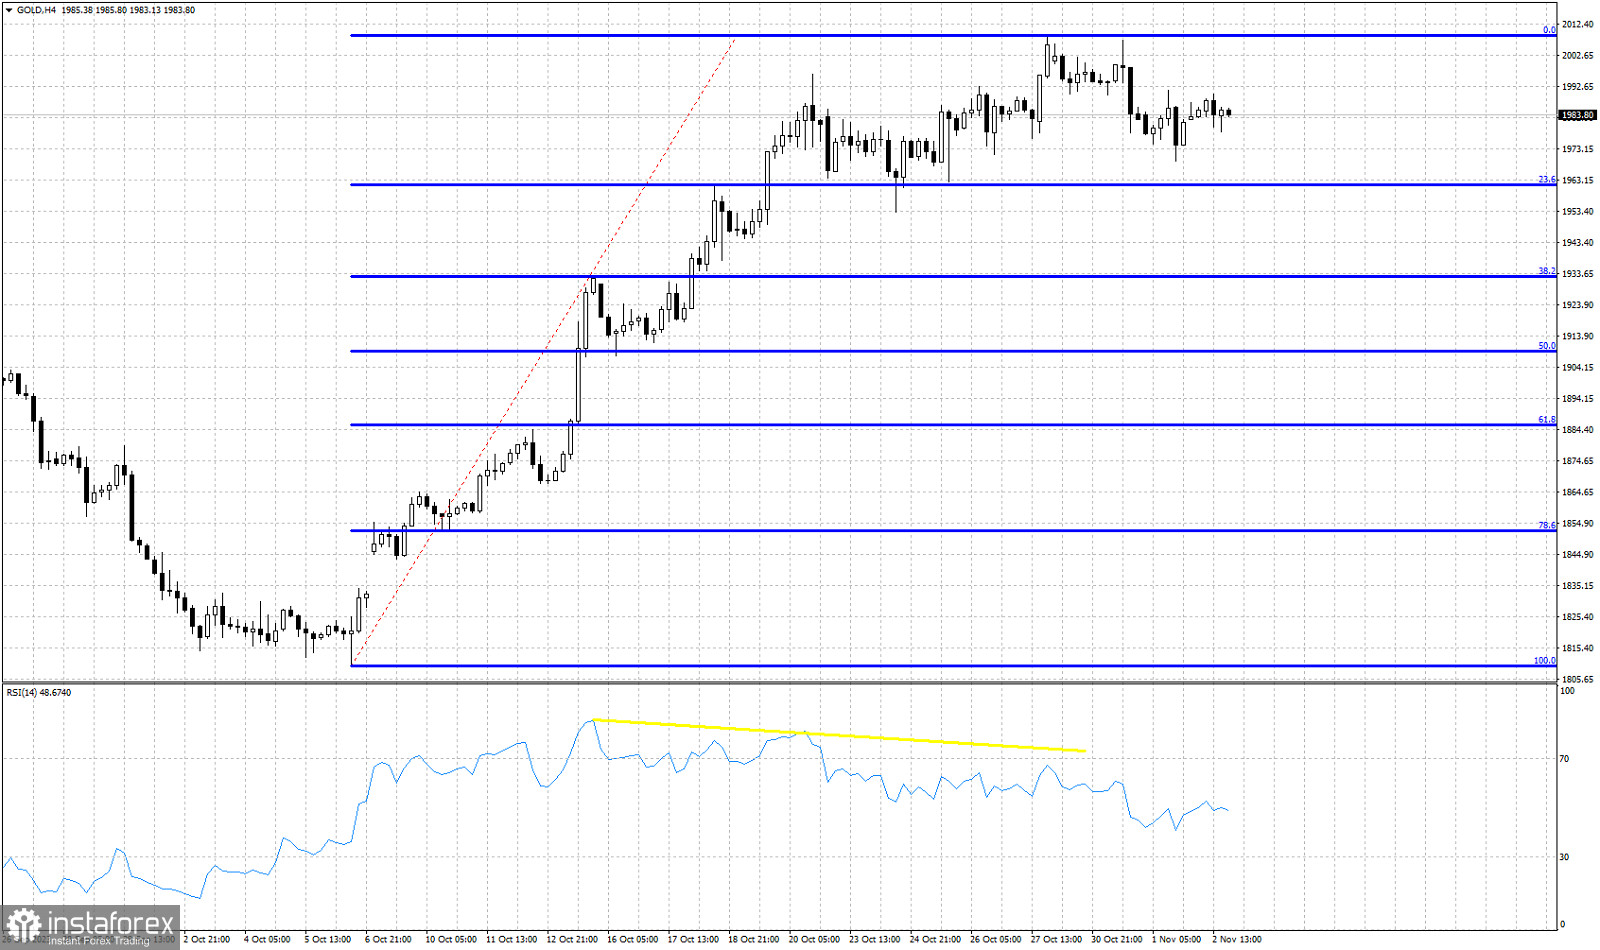
Blue lines- Fibonacci retracement levels
Yellow line- bearish RSI Divergence
Gold price is trading around $1,982. Since October 20th, Gold price is mostly moving sideways. Price made a higher high at $2,008 and a low at $1,962 since the end of October. The 23.6% Fibonacci retracement has not be broken. Price has made no real progress to the upside. Price is mostly moving around $1,980. The RSI provided us with a bearish divergence warning, but price did not start any decline. The RSI has fallen from overbought levels to the middle of the range, while price has mostly moved sideways. Unless we see a break below $1,960 tomorrow after the NFP announcement, we should not be surprised if the coming days bulls recapture the $2,000 price level and stay above it.


