


Review :
The trend of GBP/USD pair movement was controversial as it took place in the downtrend channel. Due to the previous events, the price is still set between the levels of 1.2291 and 1.2153, so it is recommended to be careful while making deals in these levels because the prices of 1.2291 and 1.2153 are representing the resistance and support respectively.
The GBP/USD pair has faced strong resistances at the levels of 1.2291 because support had become resistance. So, the strong resistance has been already formed at the level of 1.2291 and the pair is likely to try to approach it in order to test it again. The market will indicate a bearish opportunity below the new strong resistance level of 1.2291 (the level of 1.2291 coincides with a ratio of 61.8% Fibonacci).
Moreover, the RSI starts signaling a downward trend, as the trend is still showing strength above the moving average (100) and (50). Thus, the market is indicating a bearish opportunity below 1.2291, for that it will be good to sell the below the are of 1.2291. Therefore, it is necessary to wait till the downtrend channel is passed through.
Then the market will probably show the signs of a bearish market. In other words, sell deals are recommended below the price of 1.2291 with the first target at the level of 1.2153. From this point, the pair is likely to begin an descending movement to the price of 1.2068 with a view to test the daily support at 1.1990.
If the pair fails to pass through the level of 1.2291, the market will indicate a bearish opportunity below the strong resistance level of 1.2291. In this regard, sell deals are recommended lower than the 1.2291 level with the first target at 1.2153. It is possible that the pair will turn downwards continuing the development of the bearish trend to the levels of 1.2068 and 1.1990.
However, stop loss has always been in consideration thus it will be useful to set it above the last double top at the level of 1.2430 (notice that the major resistance today has set at 1.2430). The stop loss should always be taken into account, for that it will be reasonable to set your stop loss at the level of 1.2430.
The GBP/USD pair traded in different directions in the range of 1.2206 - 1.2350 and closed the day without significant changes. Today the pair also traded in a narrow range of 1.2240-1.2200, remaining close to Friday's closing price.
On the hourly chart, the GBP/USD pair is still testing the strength of the support - the moving average line MA (100) H1 (1.2249). The situation is similar on the four-hour chart. Based on the above, it is probably worth sticking to the north direction in trading and while the pair remains above MA 100 H1, may be you need to look for entry points to buy at the end of the correction.
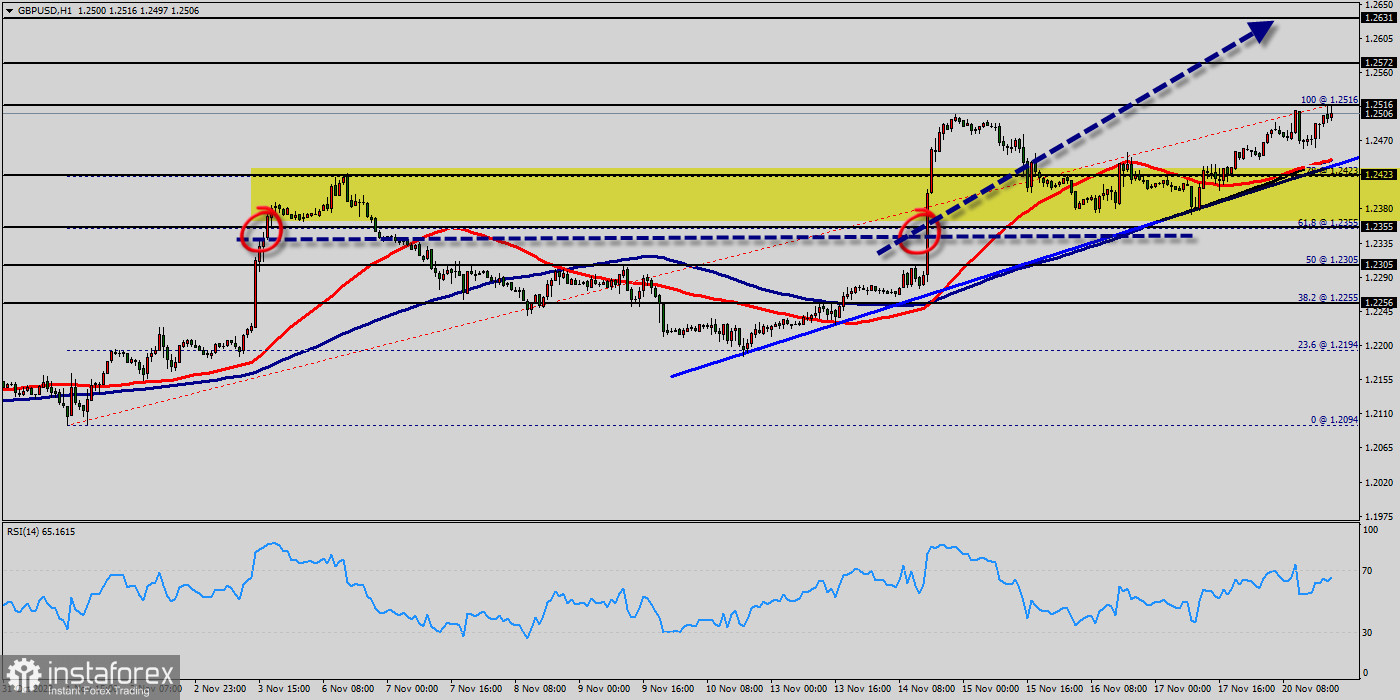
From a technical point of view, the GBP/USD pair holds on the winning side, according to the daily chart. The pair develops well above a bullish 50 Simple Moving Average (SMA), currently providing dynamic support at around 1.2153. The 50 and 100 SMAs offer modest downward slopes, converging around the 1.2249 price zone.
Finally, the Momentum indicator aims north, firmly bouncing from its midline, while the Relative Strength Index (RSI) indicator consolidates around 66. The GBP/USD pair has faced strong support at the level of 1.2153 because resistance became support. So, the strong support has been already faced at the level of 1.2153 and the pair is likely to try to approach it in order to test it again.
The level of 1.2249 represents a weekly pivot point for that it is acting as minor support this week. Furthermore, the GBP/USD pair is continuing to trade in a bullish trend from the new support level of 1.2153. Currently, the price is in a bullish channel. According to the previous events, we expect the GBP/USD pair to move between 1.2153 and 1.2350.
Also, it should be noticed that the double top is set at 1.2430. Additionally, the RSI is still signaling that the trend is upward as it remains strong above the moving average (100). This suggests the pair will probably go up in coming hours. Accordingly, the market is likely to show signs of a bullish trend. In other words, buy orders are recommended above 1.2249 with the first target at the level of 1.2350. If the trend is be able to break the double top at the level of 1.2350, then the market will continue rising towards the weekly resistance 1 at 1.2430 so as to test the ast bullish wave.


