


Review :
A trend in the EUR/USD pair was argumentative as it was trading in a narrow sideways channel, the market showed signs of instability. Amid the previous events, the price is still moving between the levels of 1.0534 and 1.0780. Resistance and support are seen at the levels of 1.0780 (also, the double top is already set at the point of 1.0780) and 1.0636 respectively. Therefore, it is recommended to be cautious while placing orders in this area.
So, we need to wait until the sideways channel has completed. The current price is seen at 1.0691 which represents a key level today. The level of 1.0725 will act as the first resistance today. Consequently, there is a possibility that the EUR/USD pair will move downside. The structure of a fall does not look corrective.
In order to indicate a bearish opportunity below the spot of 1.0725 - 1.0748, The level of 1.0756 coincides with 61.8% of Fibonacci, which is expected to act as a major resistance today. Since the trend is below the 61.8% Fibonacci level, the market is still in a downtrend.
Overall, we still prefer the bearish scenario. Hence, if the pair fails to pass through the level of 1.0725, the market will indicate a bearish opportunity below the strong resistance level of 1.0725. Sell deals are recommended below the level of 1.0725 with the first target at 1.0670.
If the trend breaks the support level of 1.0670, the pair is likely to move downwards continuing the development of a bearish trend to the level 1.0636 so as to test the double bottom at the hourly chart. The market is still in an downtrend. We still prefer the bearish scenario. In case a reversal takes place and the EUR/USD pair breaks through the support level of 1.0636, a further decline to 1.0603 can occur, which would indicate a bearish market.
Overall, we still prefer the bearish scenario, which suggests that the pair will stay below the zone of 1.0725 today. The EUR/USD pair has broken through the ceiling of a falling trend channel in the medium long term. This indicates a slower falling rate initially, or the start of a more horizontal development.
The currency has support at points 1.0639 and resistance at points 1.0756. The EUR/USD pair traded higher and closed the day in the positive territory around the price of 1.0700. Today the pair was trading in a narrow range of 1.0630 - 1.0756, remaining close to Monday's closing price. On the hourly chart, the EUR/USD pair is still testing the strength of the support - the moving average line MA (100) H1 (1.0639).
On the four-hour chart, the pair still remains above the MA 200 H4 line. Based on the above, it is probably worth sticking to the north direction in trading and while the pair remains above the MA 200 H1, may be you need to look for entry points to buy when a correction is formed. Despite the somewhat dovish stance of Fed members causing a surge in risk assets last week, the US dollar index also experienced a partial uptick, reaching a peak near 100.
After facing resistance at this level, the greenback stalled as investors switched to a cautious stance ahead of the upcoming US inflation data release. The EUR/USD pair bottomed at 1.0526 and then reversed to the upside, driven by a weaker US Dollar. The pair is approaching 1.0697 and has moved back into positive territory for the day, in a relatively calm trading session.
Market participants are awaiting Eurozone growth and employment data and US CPI figures, which are due on Monday. Probably, the main scenario is a resumption of growth to 1.0700 (Nov 13 high). Thee alternative scenario involves consolidation below MA 100 H1, followed by a decline to 1.0526 (low). Price actions from the level of 1.0639 are viewed as a corrective pattern to rise from 1.0639. Rise from the price of 1.0639 is tentatively seen as the second leg.
Hence while further rally could be seen, upside should be limited by 1.0700 to bring the third leg of the pattern. However, break of 1.0697 will resume the fall to 50% retracement of 1.0756 to 1.0800 at 1.0837.
The trend of EUR/USD pair movement was controversial as it took place in the downtrend channel. Due to the previous events, the price is still set between the levels of 1.0850 and 1.0773, so it is recommended to be careful while making deals in these levels because the prices of 1.0850 and 1.0773 are representing the resistance and support respectively. Therefore, it is necessary to wait till the downtrend channel is passed through. Then the market will probably show the signs of a bearish market.
In other words, sell deals are recommended below the price of 1.0850 with the first target at the level of 1.08000. From this point, the pair is likely to begin an descending movement to the price of 1.0770 with a view to test the daily support at 1.0770. The US Dollar has been losing ground against some of its major counterparts, such as the Euro and British Pound.
In response, retail traders have been responding by decreasing downside exposure in the US Dollar currency. The EUR/USD pair will continue rising from the level of 1.0712 today. So, the support is found at the level of 1.0712, which represents the 50% Fibonacci retracement level in the H1 time frame. Since the trend is above the 50% Fibonacci level, the market is still in an uptrend. With that in mind, is there more room for the Euro to rally?
On the hourly chart, the EUR/USD pairis showing signs of an increasingly bullish technical bias. Prices have broken under the rising trendline from September. Meanwhile, a bullish between the 50- and 100-day Simple Moving Averages is present (SMA).
Currently, prices are idling just under the 1.0700 and 1.0715 inflection zone. Key support below is the 50% Fibonacci retracement level at 1.0712. In the event of a turn higher, the moving averages may hold as key resistance, maintaining the upside focus.
The EUR/USD pair has faced strong support at the level of 1.0712 because resistance became support. So, the strong resistance has been already faced at the level of 1.0788 and the pair is likely to try to approach it in order to test it again. The level of 1.0712 represents a weekly pivot point for that it is acting as minor support this week.
Furthermore, the EUR/USD pair is continuing to trade in a bullish trend from the new support level of 1.0712. Currently, the price is in a bullish channel. According to the previous events, we expect the EUR/USD pair to move between 1.0712 and 1.0814. Also, it should be noticed that the double top is set at 1.0788.
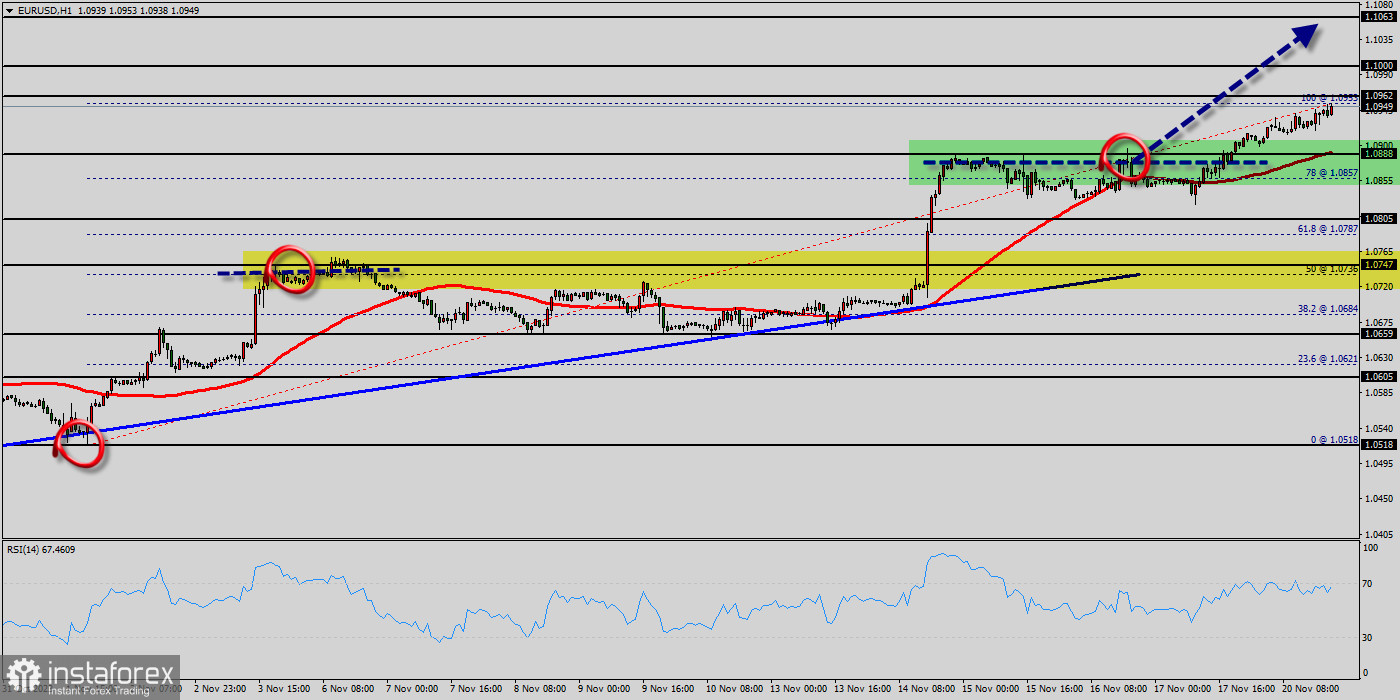
Additionally, the RSI is still signaling that the trend is upward as it remains strong above the moving average (100). This suggests the pair will probably go up in coming hours. Accordingly, the market is likely to show signs of a bullish trend. In other words, buy orders are recommended above 1.0712 with the first target at the level of 1.0788.
If the trend is be able to break the double top at the level of 1.0788, then the market will continue rising towards the weekly resistance 1 at 1.0814. However, the price spot of 1.0814 remains a significant resistance zone. Thus, the trend will probably be rebounded again from the double top as long as the level of 1.0814 is not breached. The market is still in an uptrend. We still prefer the bullish scenario.


