


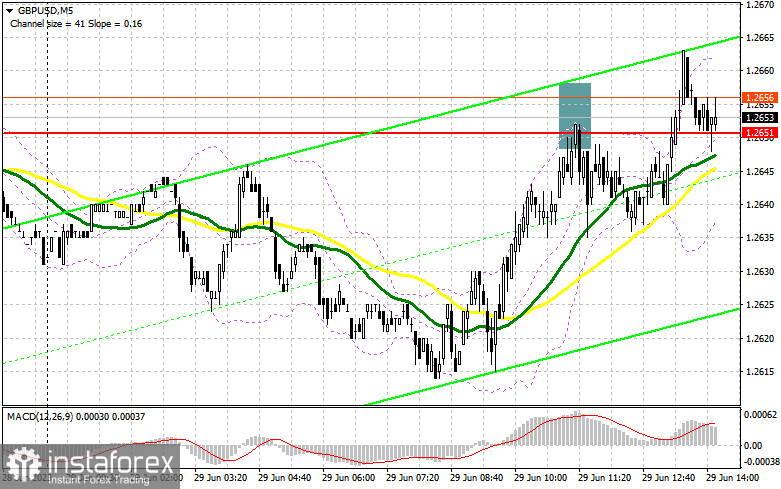
In my morning article, I turned your attention to 1.2651 and recommended making decisions with this level in focus. Now, let's look at the 5-minute chart and figure out what actually happened. A rise and a false breakout of this level gave a sell signal in the continuation of yesterday's movement but there was no large drop. After a decline of 15 pips, the pound sterling returned to 1.2651. Judging by the technical indicators, nothing has changed considerably.
When to open long positions on GBP/USD:
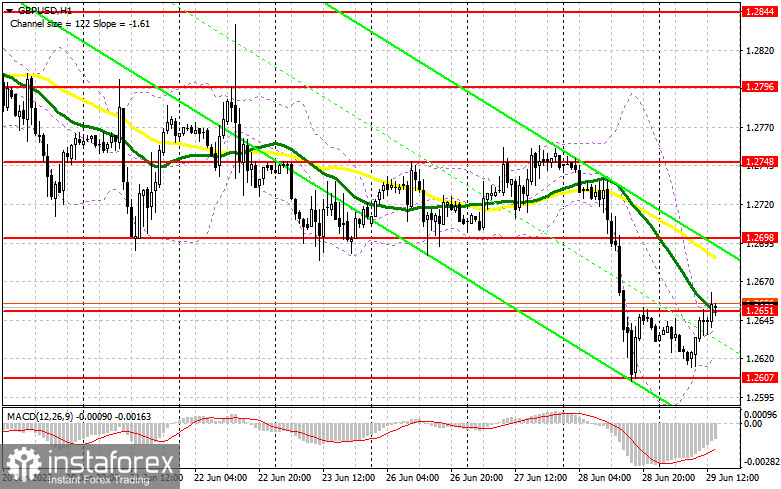
It is better to go long when the price rises to 1.2651 but only if fresh US labor market data and GDP figures for the first quarter are downbeat. A decline and a false breakout of 1.2651 will provide an excellent entry point for the continuation of the uptrend. It could trigger an increase to 1.2698 where the moving averages that limit the upside potential of the pair are passing. A breakout and a downward retest of this level will undermine bearish sentiment, giving an additional buy signal. The pair is likely to appreciate to 1.2748. A more distant target will be the 1.2796 level where I recommend locking in profits.
If the GBP/USD pair declines to 1.2651, bulls fail to protect this level, and reports are positive, the pressure on the pound sterling will return. Bulls will have to leave the market. In this case, only the protection of 1.2607 as well as a false breakout of this level may provide new entry points into long positions. You could buy GBP/USD at a bounce from 1.2569, keeping in mind an upward intraday correction of 30-35 pips.
When to open short positions on GBP/USD:
Sellers need to take control of 1.2651 as quickly as possible. Another return to this level and an upward retest of this level could generate a sell signal with a downward movement to 1.2607, which the pair failed to hit in the morning. A breakout and an upward retest of this level will force bulls to close their positions, pushing GBP/USD to 1.2569. It will significantly boost a bear market. a more distant target will be the 1.2527 level where I recommend locking in profits.
If GBP/USD rises and bears fail to defend 1.2651 in the afternoon, another attempt at a downward correction will hardly take place. Bulls will regain control of the market. In this case, I would advise you to postpone short positions until a test of the resistance level of 1.2698 where the moving averages are passing in negative territory. A false breakout there will give an entry point into short positions. If there is no downward movement there, you could sell GBP/USD at a bounce from 1.2698, keeping in mind a downward intraday correction of 30-35 pips.
COT report
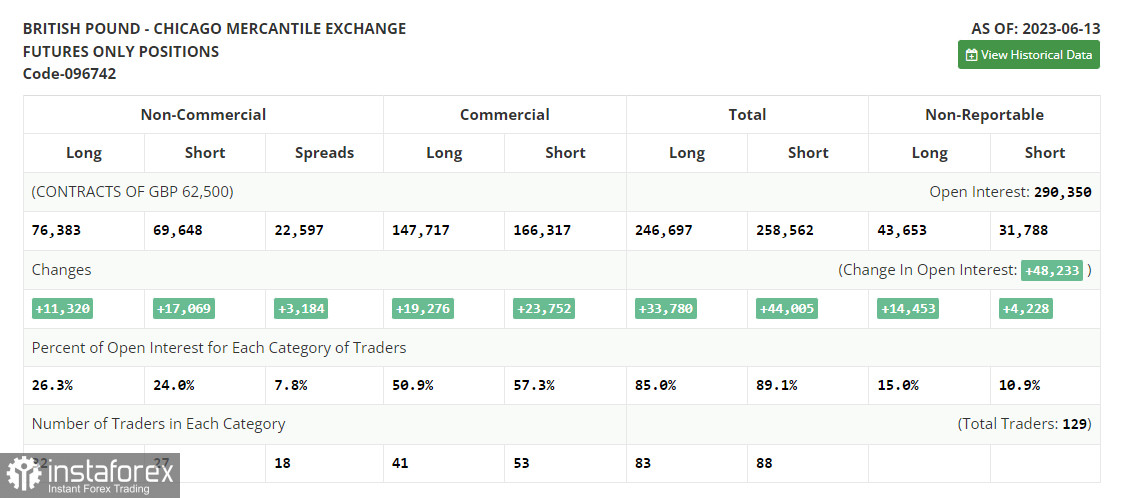
According to the COT report (Commitment of Traders) for June 13, there was a sharp increase in long and short positions. The pound sterling has grown markedly recently. As a rest, sellers began to enter the market. However, the BoE's aggressive tightening and the latest inflation data boosted an upward movement. Traders are betting on new rate hikes. The fact that the Fed skipped a rate hike in its tightening cycle. However, the Bank of England will hardly take a pause. It spurs demand for the pound sterling. The latest COT report showed that short non-profit positions rose by 17,069 to 69,648, while long non-profit positions jumped by 11,320 to 76,383. This led to a slight decrease in the non-commercial net position to 6,736 against 12,454 a week earlier. The weekly price climbed to 1.2605 against 1.2434.
Indicators' signals:
Trading is carried out slightly below the 30 and 50 daily moving averages, which indicates a further decrease.
Moving averages
Note: The period and prices of moving averages are considered by the author on the H1 (1-hour) chart and differ from the general definition of the classic daily moving averages on the daily D1 chart.
Bollinger Bands
If GBP/USD declines, the indicator's lower border at 1.2607 will serve as support.
Description of indicators
- Moving average (moving average, determines the current trend by smoothing out volatility and noise). Period 50. It is marked yellow on the chart.
- Moving average (moving average, determines the current trend by smoothing out volatility and noise). Period 30. It is marked green on the chart.
- MACD indicator (Moving Average Convergence/Divergence - convergence/divergence of moving averages) Quick EMA period 12. Slow EMA period to 26. SMA period 9
- Bollinger Bands (Bollinger Bands). Period 20
- Non-commercial speculative traders, such as individual traders, hedge funds, and large institutions that use the futures market for speculative purposes and meet certain requirements.
- Long non-commercial positions represent the total long open position of non-commercial traders.
- Short non-commercial positions represent the total short open position of non-commercial traders.
- Total non-commercial net position is the difference between the short and long positions of non-commercial traders.


