


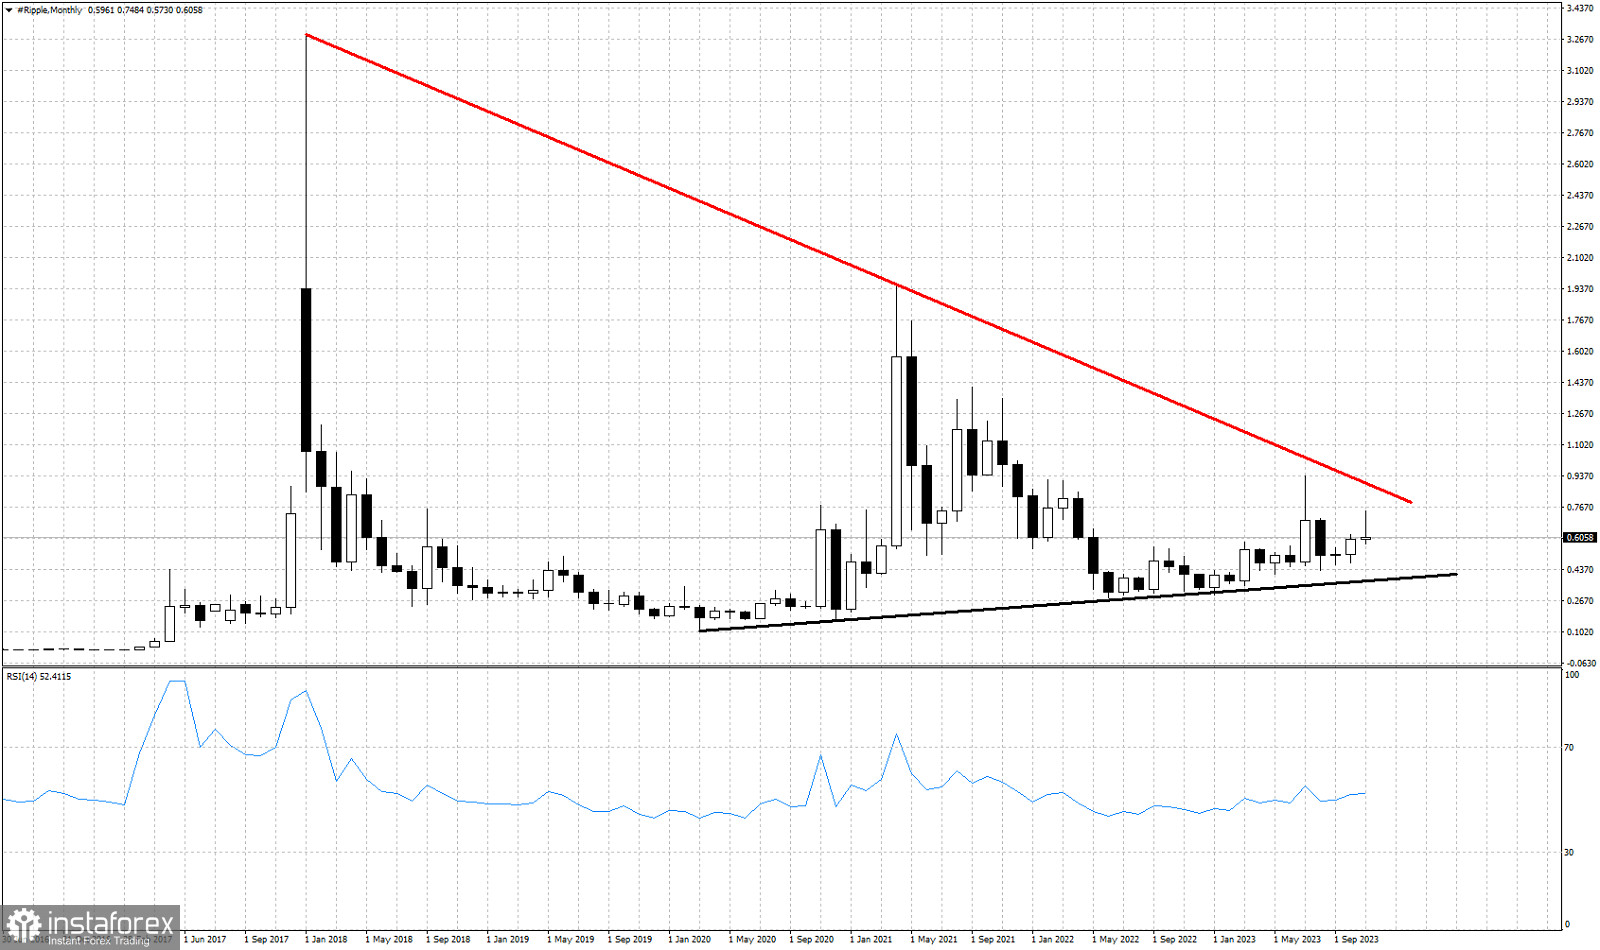
Red line- major resistance trend line
Black line- major support trend line
XRPUSD is trading around $0.60 at the end of November. Having reached as high as $0.7484, bulls were unable to maintain price above $0.70. The long-term red downward sloping resistance trend line remains intact. As long as this is the case, there is no bullish scenario. The candlestick of November has so far shown that XRPUSD remains inside its sideways trend and bulls are not strong enough for a break out. The long-term triangle pattern is still in play with price trapped between the red resistance trend line and the black upward sloping support trend line. XRPUSD formed a new lower high, implying that the next month could see price decline towards the black support trend line. As long as price is below $0.7484, XRPUSD will remain vulnerable to more downside. Bulls need to recapture $0.75 in order to hope for a test of the resistance at $0.86.


