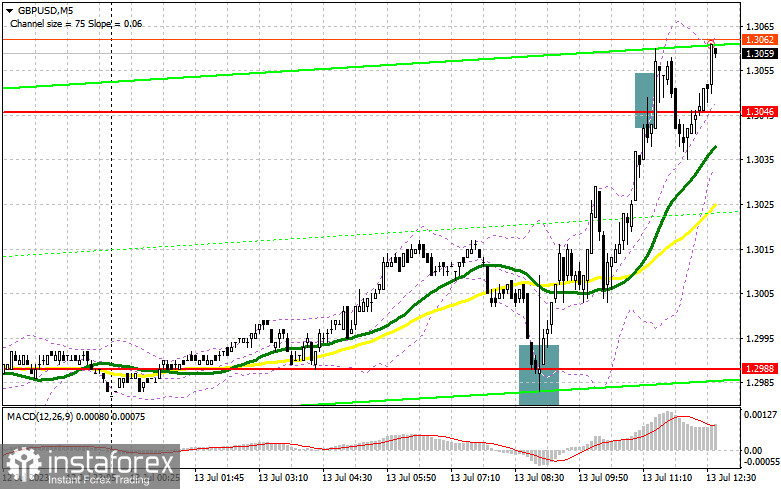
In my morning forecast, I drew attention to the 1.2988 level and recommended making market entry decisions from it. Let's look at the 5-minute chart and figure out what happened there. A decrease and the formation of a false breakout at 1.2988 allowed for an excellent entry point into long positions, which led to a rise in the pair by more than 60 points. Sales from 1.3046 were unsuccessful, although expecting them in such a bullish market took a lot of work.

To open long positions on GBP/USD:
The data on the UK economy did not turn out as terrible as forecasted, which restored demand for the pound and resulted in another update of annual highs. History may repeat itself in the second half of the day after the release of reports on the number of initial claims for unemployment benefits and the producer price index in the US. A decrease in producer prices will likely further weaken the dollar's position against the pound.
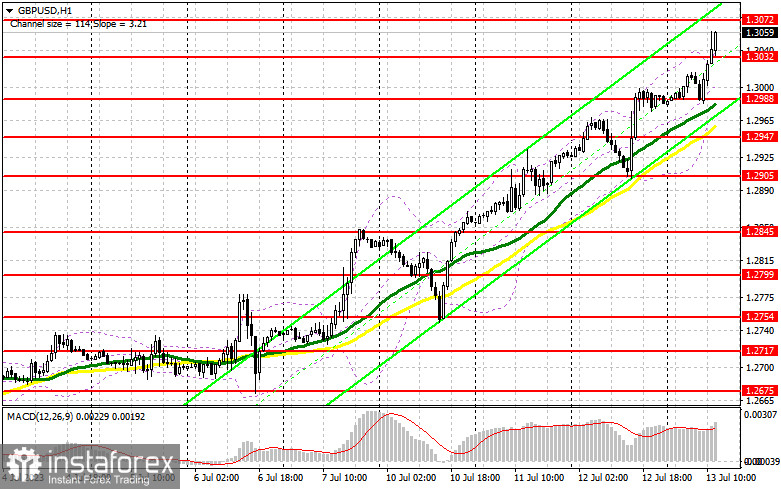
Given how much we have moved up recently, I prefer to open long positions in the second half of the day only after a decrease and the formation of a false breakout in the area of new support at 1.3032. This would be enough to get a signal to buy the pound in continuation of the trend development with a target of an increase to around 1.3072, which is being tested at the time of writing the article. A breakthrough and consolidation above this range will form an additional signal to buy with a move to 1.3097. The farthest target will be the 1.3122 area, where I will fix profits. In the scenario of a GBP/USD decrease during the American session against the backdrop of high producer inflation, good labor market indicators, and the absence of buyers at 1.3032, pressure on the pound will increase, leading to a downward correction. In such a case, only the protection of the next 1.2988 area and a false breakout on it will signal to open long positions. I plan to buy GBP/USD immediately on a rebound only from 1.2947 with a correction target of 30-35 points within the day.
To open short positions on GBP/USD:
Sellers remain on the sidelines for now, as there are no fundamental and technical reasons for their appearance. The pound can be considered overbought, as the bull market has been going on for almost two weeks. But to discuss any correction, we must stop updating daily and annual highs. If today's data signal an increase in price pressure in the US, the pound may fall. But I will act against the trend only on a false breakout in 1.3072, where the pair is now trading. This will give us a sell signal, returning pressure on GBP/USD to update 1.3032. A breakthrough and a reverse test from the bottom to the top of this range will deliver a more serious blow to buyers' positions, knocking GBP/USD down to 1.2988, where the moving averages, playing on the bulls' side, pass. The farthest target remains the minimum of 1.2947, where I will fix profits. 
In the event of further GBP/USD growth and absence of activity at 1.3072 in the second half of the day, the bull market's evolution will continue. In such a case, I will delay selling until the resistance test at 1.3097. A false breakout there will provide an entry point for short positions. If there is no downward movement there, I will sell the pound immediately on a rebound from 1.3122, but only considering a downward correction of the pair by 30-35 points within the day.
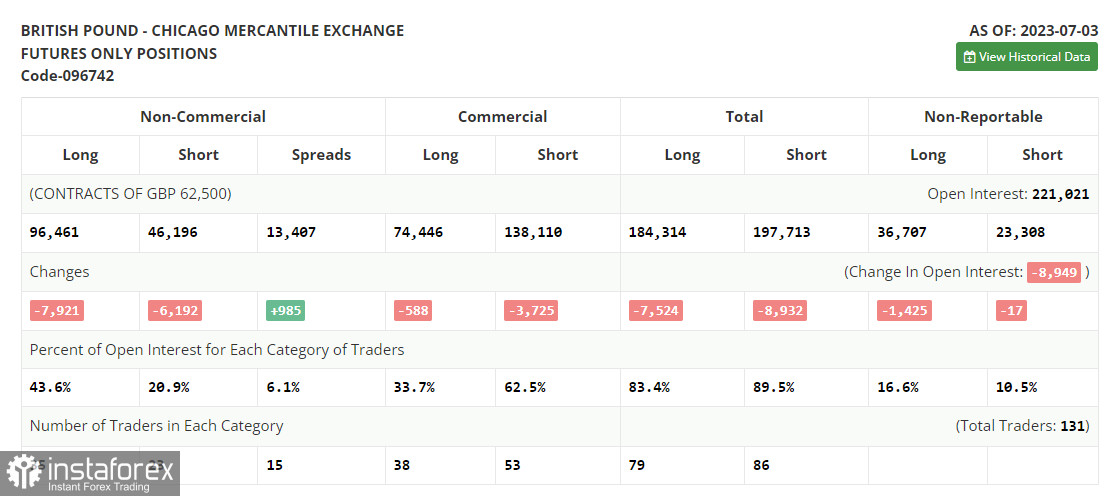
In the COT (Commitment of Traders) report for July 3, a reduction in both short and long positions was observed. Pound buyers definitely have all chances to act more aggressively going forward, as the Bank of England, despite all the pressure and economic problems, will continue to adhere to a high-interest-rate policy due to severe inflationary issues affecting household living standards. As for the Federal Reserve, regardless of what politicians say, traders are revising their attitude towards the dollar, betting on its weakening in the medium term. This is caused by US interest rates, which are about to reach their peak values. The optimal strategy remains to buy the pound on the decline. The latest COT report states that short non-commercial positions decreased by 6,192 to 46,196, while long non-commercial positions dropped by 7,921 to a level of 96,461. This led to a slight reduction in the non-commercial net position to the level of 50,265 compared to 51,994 a week earlier. The weekly price decreased and amounted to 1.2698 against 1.2735.

Indicator signals:
Moving averages
Trading is conducted above 30 and 50-day moving averages, which indicates the pair's further growth.
Note: The period and prices of the moving averages are considered by the author on the hourly chart H1 and differ from the general definition of classic daily moving averages on the daily chart D1.
Bollinger Bands
In case of a decrease, the lower border of the indicator around 1.2950 will act as support.
Description of indicators:
• Moving Average (a trend-following indicator that smooths out volatility and noise). Period 50. Marked in yellow on the chart.
• Moving Average (a trend-following indicator that smooths out volatility and noise). Period 30. Marked in green on the chart.
• MACD indicator (Moving Average Convergence/Divergence) Fast EMA period 12. Slow EMA period 26. SMA period 9.
• Bollinger Bands (bands that measure volatility and identify overbought or oversold conditions). Period 20.
• Non-commercial traders - speculators, such as individual traders, hedge funds, and large institutions, who use the futures market for speculative purposes and meet specific requirements.
• Long non-commercial positions represent the total long open positions of non-commercial traders.
• Short non-commercial positions represent the total short open positions of non-commercial traders.
• Net non-commercial position is the difference between non-commercial traders' short and long positions.


