Technical Analysis of GBP/USD for December 13, 2023: Navigating Through Economic Headwinds
Key Highlights:
- Economic Outlook Impacting GBP: Recent economic data suggests a looming recession in the eurozone, with the UK economy also showing signs of struggle. The Pound's response to these challenges is crucial for traders.
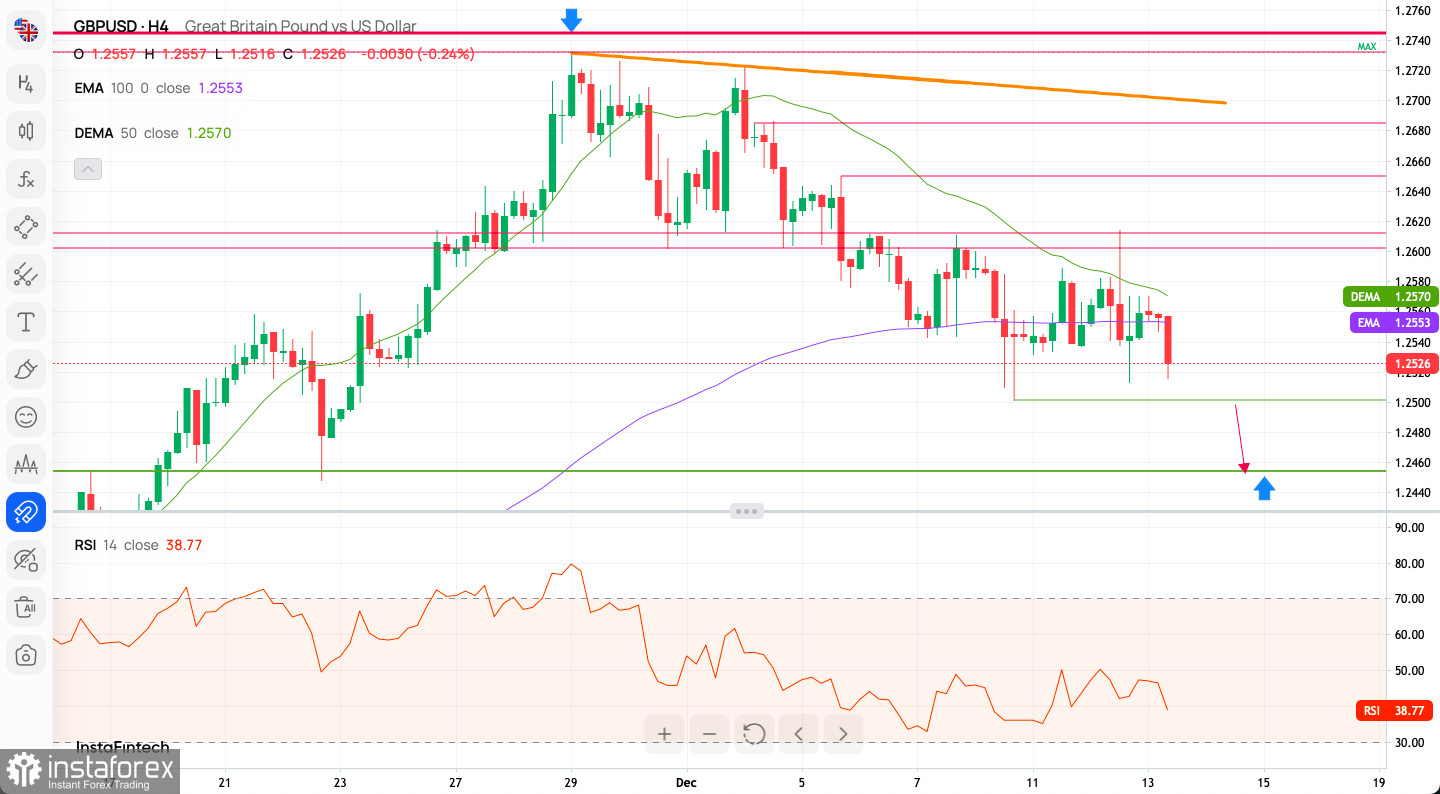
- GBP/USD Technical Analysis: After forming a low at 1.2501, the GBP/USD pair has rebounded, breaking through key resistance levels. The bullish short-term outlook hinges on surpassing specific targets, with a focus on the 50 MA at 1.2597.
- Market Sentiment and Indicators: Current market sentiment leans heavily towards the bulls, with technical indicators predominantly signaling a sell. The consistent bullish sentiment over the last week and recent days underscores the market's optimistic outlook.
Pound's Response to Economic Challenges
Recent economic data indicates a possible recession in the eurozone in the last quarter of the year. This news also suggests challenges for the U.K. economy. In October, Britain's economy contracted, marking the first monthly decline in GDP since July. This decline raises concerns about a potential recession. Additionally, British industrial production in October decreased by 0.8% monthly, staying flat year-on-year.

Technical Market Outlook
The GBP/USD pair recently made a low at 1.2501, forming a Pin Bar, before rebounding towards the resistance at 1.2601. The pair has surpassed levels of 1.2547 and 1.2570, establishing them as new support points. The next target for bulls is the 50 MA at 1.2597. On the H4 chart, momentum has recovered from oversold conditions. The short-term outlook is bullish. However, for the uptrend to continue, bulls must break above 1.2602 and 1.2613.
Weekly Pivot Points
- WR3: 1.2905
- WR2: 1.2815
- WR1: 1.2682
- Weekly Pivot: 1.2592
- WS1: 1.2459
- WS2: 1.2369
- WS3: 1.2236
Trading Outlook
The weekly chart shows a Bullish Engulfing pattern after breaking the 1.2340 level, indicating bullish sentiment. The market is above the 50-week MA, heading towards the 100 WMA at 1.2504. A break below 1.1802 could lead to significant declines, possibly reaching 1.1494.
GBP/USD H1 Intraday Indicator Signals
- Sell Signal: 20 out of 21 technical indicators
- Neutral: 3 indicators
- Buy Signal: 0 indicators
- Buy Signal for Moving Averages: 18 out of 18
Sentiment Scoreboard
The current sentiment is predominantly bullish (58% bulls vs. 42% bears). Last week also showed a bullish trend (55% bulls vs. 45% bears). The sentiment over the past three days has maintained this bullish bias (55% bulls vs. 45% bears).
Useful Links
Important Reminder
The begginers in forex trading need to be very careful when making decisions about entering the market. Before the release of important reports, it is best to stay out of the market to avoid being caught in sharp market fluctuations due to increased volatility. If you decide to trade during the news release, then always place stop orders to minimize losses.
Without placing stop orders, you can very quickly lose your entire deposit, especially if you do not use money management and trade large volumes. For successful trading, you need to have a clear trading plan and stay focues and disciplined. Spontaneous trading decision based on the current market situation is an inherently losing strategy for a scalper or daytrader.


