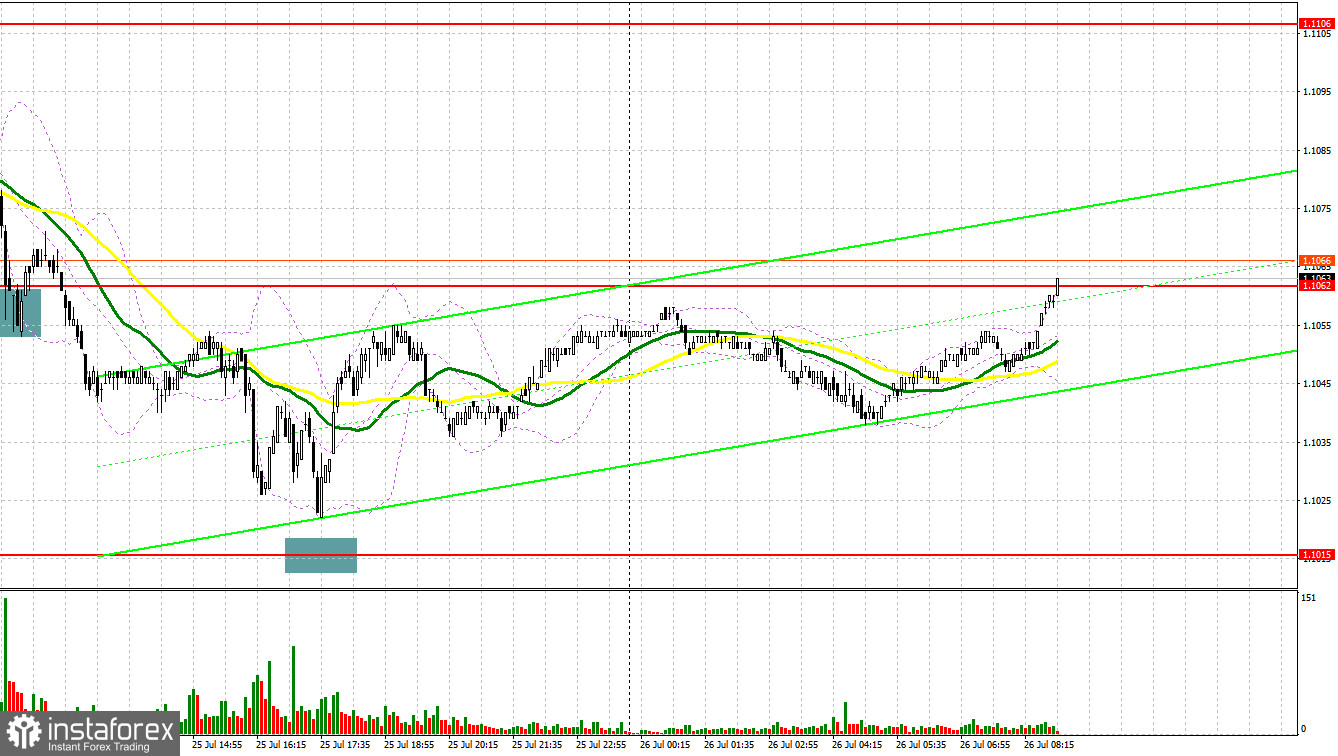
Yesterday, there was only one entry point. Let's look at the 5-minute chart and figure out what actually happened. In my morning forecast, I turned your attention to the level of 1.1062 and recommended making decisions with this level in focus. A decline and false breakout at 1.1062 generated a buy signal, but the pair did not rise significantly. After a weak report from Germany, the pair continued to fall, leading to losses being realized. In the second half of the day, the pair did not reach 1.1015, so there was no buy signal.

For long positions on EUR/USD:
Today, euro buyers will have the chance to push the pair higher in the first half of the day, but this will unlikely bring forth a significant movement before the Federal Reserve's interest rate decision, which we will discuss in the forecast for the second half of the day. During the European session, the figures for the eurozone's M3 money supply and private sector lending will be released. These reports are quite important for the European Central Bank, as a decrease in lending figures amid high interest rates could have a negative impact on the region's economic growth rate.
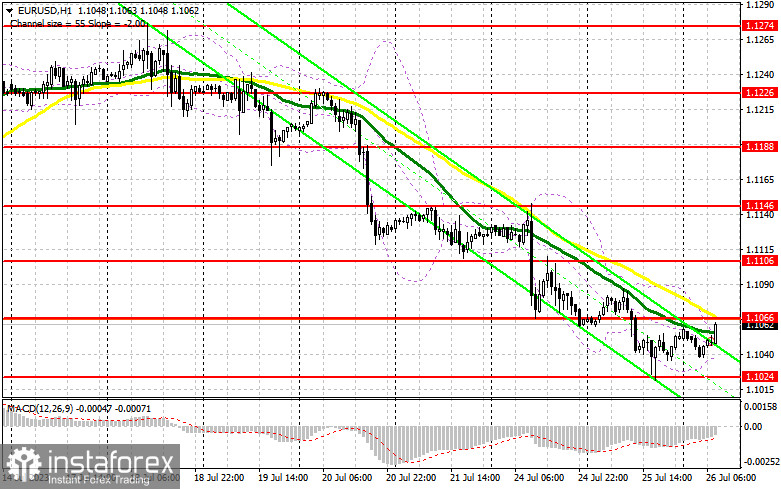
Bad numbers may limit the euro's growth and the single currency will be under pressure, which will lead to a test of the 1.1024 level formed at the end of yesterday. A decline and a false breakout of that level will provide a buy signal, allowing the instrument to return to growth and update the new resistance level of 1.1066, which is in line with the bearish moving averages. A break and downward test of this range will boost the demand for the euro, giving it a chance to climb as high as 1.1106. The most distant target remains around 1.1146, where I will take profits.
If EUR/USD declines and bulls fail to defend 1.1024, which is unlikely before the Fed meeting, this will be bad for the buyers. Therefore, only a false breakout near the next support level at 1.0981 may create entry points into long positions. You could buy EUR/USD at a bounce from the 1.0946 low, keeping in mind an upward intraday correction of 30-35 pips.
For short positions on EUR/USD:
Today presents an opportunity for the bears to build a downward correction, but given the Fed meeting and their possible decisions, it is better not to hurry with short positions. Now it is very important for them to defend the resistance level at 1.1066, which will be tested soon. I will preferably act only after a false breakout of that level, which will give a sell signal and potentially send the pair down to the new support level at 1.1024. I expect large buyers to emerge from that level, but considering that this level has already been tested once, it's possible that bulls might retreat again. Should the pair break below the level and consolidate below this range, coupled with an upward retest, a sell signal might be generated, setting the stage for a direct move towards 1.0981. This would indicate the formation of a bearish trend, but without a firm stance from the Fed, it's unlikely to happen. The most distant target in this case will be around 1.0946, where I will take profits.
If EUR/USD rises during the European session and bears fail to protect 1.1066, which is possible, the bulls will regain control of the market. In this case, I would advise you to postpone short positions until a false breakout of the resistance level of 1.1106. You could sell EUR/USD at a bounce from the 1.1146 high, keeping in mind a downward intraday correction of 30-35 pips.

COT report:
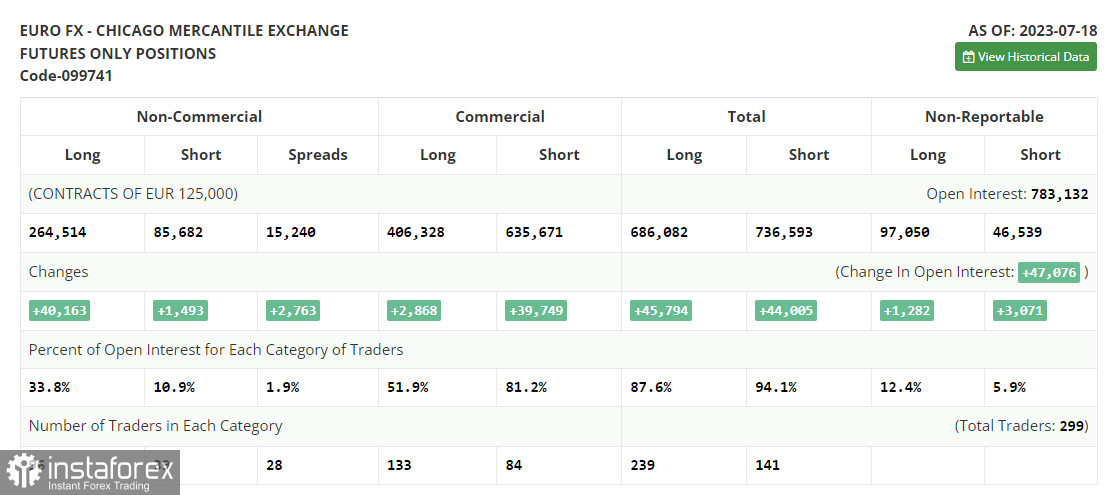
In the COT report (Commitment of Traders) for July 18, there was an increase in both long and short positions. However, there were much more buyers, which strengthened the balance of trading forces in the market in their favor. The data on the US inflation triggered buying of risky assets, including the euro. Last week, ECB policymakers stated that it would be the right time to step up with a hawkish policy in the Eurozone. Such prospects only cemented expectations and bets on further growth of the euro against the US dollar. The Federal Open Market Committee will meet this week to decide on monetary policy. Many economists expect them to announce the last rate hike in a nearly 1.5-year cycle of monetary tightening. Such prospects will further weaken the dollar. The ECB meeting is likely to be hawkish. For this reason, while the market is bullish, buying the euro on dips remains the optimal medium-term strategy. The COT report shows that long non-commercial positions rose by 40,163 to 264,514, while short non-commercial positions grew only by 1,493 to 85,682. At the end of the week, the total non-commercial net position rose to 178,000 from 140,162. EUR/USD closed last week higher at 1.1300 versus 1.1037 a week ago.

Indicator signals:
Moving averages:
Trading is taking place below the 30-day and 50-day moving averages, indicating a possible fall in the pair.
Note: The author considers the period and prices of the moving averages on the hourly chart (H1), which differs from the general definition of classical daily moving averages on the daily chart (D1).
Bollinger Bands
If EUR/USD declines, the indicator's lower border at 1.1025 will serve as support.
Description of indicators:
• A moving average of a 50-day period determines the current trend by smoothing volatility and noise; marked in yellow on the chart;
• A moving average of a 30-day period determines the current trend by smoothing volatility and noise; marked in green on the chart;
• MACD Indicator (Moving Average Convergence/Divergence) Fast EMA with a 12-day period; Slow EMA with a 26-day period. SMA with a 9-day period;
• Bollinger Bands: 20-day period;
• Non-commercial traders are speculators such as individual traders, hedge funds, and large institutions who use the futures market for speculative purposes and meet certain requirements;
• Long non-commercial positions represent the total number of long positions opened by non-commercial traders;
• Short non-commercial positions represent the total number of short positions opened by non-commercial traders;
• The non-commercial net position is the difference between short and long positions of non-commercial traders.


