Trade overview and tips for Bitcoin trading
The Bitcoin correction is on hold due to the upcoming Federal Reserve meeting. However, the fact that it has not returned to the sideways channel suggests traders' caution before today's interest rate decision. If the decision is to maintain the status quo and wait for inflation and the economy to play out, Bitcoin could reach new yearly highs at $33,000. If they signal the need to continue the fight and not back down, Bitcoin may correct further, leading to more selling in the short term. As for yesterday's signals, there were several price tests at 29,215 with MACD in the buying zone. However, a significant upward move for Bitcoin has not occurred yet. Today, trading should be based on Scenario 1, but much depends on the Fed's actions.

Buy signal:
Scenario 1: You can buy Bitcoin when it reaches the entry point near $29,313 (green line on the chart) with the target at $29,714 (thicker green line on the chart). We can expect significant Bitcoin growth only after the end of the interest rate hike cycle by the Fed. Important! Before buying, be sure that the MACD indicator is above the zero line.
Scenario 2: Consider buying Bitcoin if it tests $29,082 twice when the MACD indicator is in the oversold zone. This is likely to limit the downside potential and lead to an upward market reversal. You can expect a rise to the opposite levels at $29,313 and $29,714.
Sell signal:
Scenario 1: One can sell Bitcoin only after it moves below $29,082 (red line on the chart), leading to a sharp decrease in the trading instrument. The key target for sellers is $28,722, where it is better to close short positions and open long ones. Pressure on Bitcoin will increase if the aggressive Fed policy continues. Before selling BTC, ensure that the MACD indicator is below the zero line.
Scenario 2: You can sell Bitcoin if it tests $29,313 twice when the MACD indicator is in the overbought zone. This is likely to limit the upside potential and lead to a downward market reversal. You can expect a drop towards the opposite levels at $29,082 and $28,722.

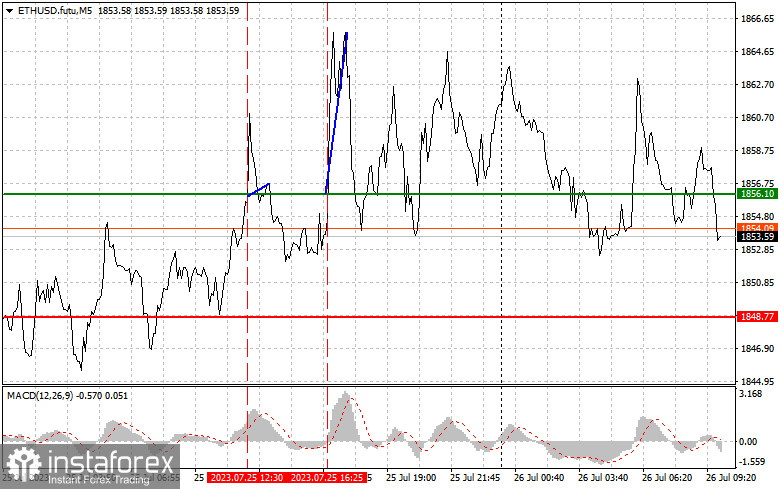
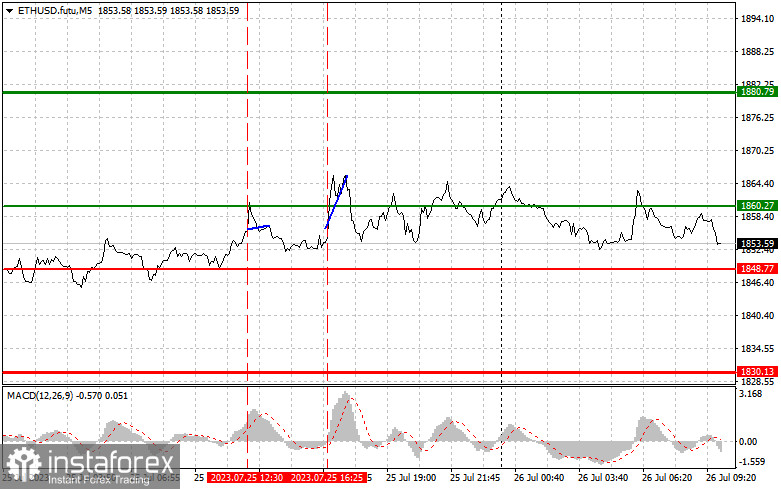
On the chart:
Thin green line – entry price for buying the trading instrument.
Thick green line – potential price to set take profit orders, as further growth beyond this level is unlikely.
Thin red line – entry price for selling the trading instrument.
Thick red line – potential price to set take profit orders, as further decline below this level is unlikely.
MACD indicator. When entering the market, pay attention to the overbought and oversold zones.
Important! Beginner traders in the cryptocurrency market should be very cautious when making trading decisions. It is better to stay out of the market before important fundamental reports to avoid sudden price fluctuations. If you decide to trade during news releases, always place stop-loss orders to minimize losses. Without stop-loss orders, you can quickly lose your entire deposit, especially if you do not use proper money management and trade with large volumes.
Remember that successful trading requires a clear trading plan, similar to the one presented above. Making spontaneous decisions based on the current market situation is an inherently losing strategy for day traders.


