GBP/USD At The Fine Balance
Technical Standpoint
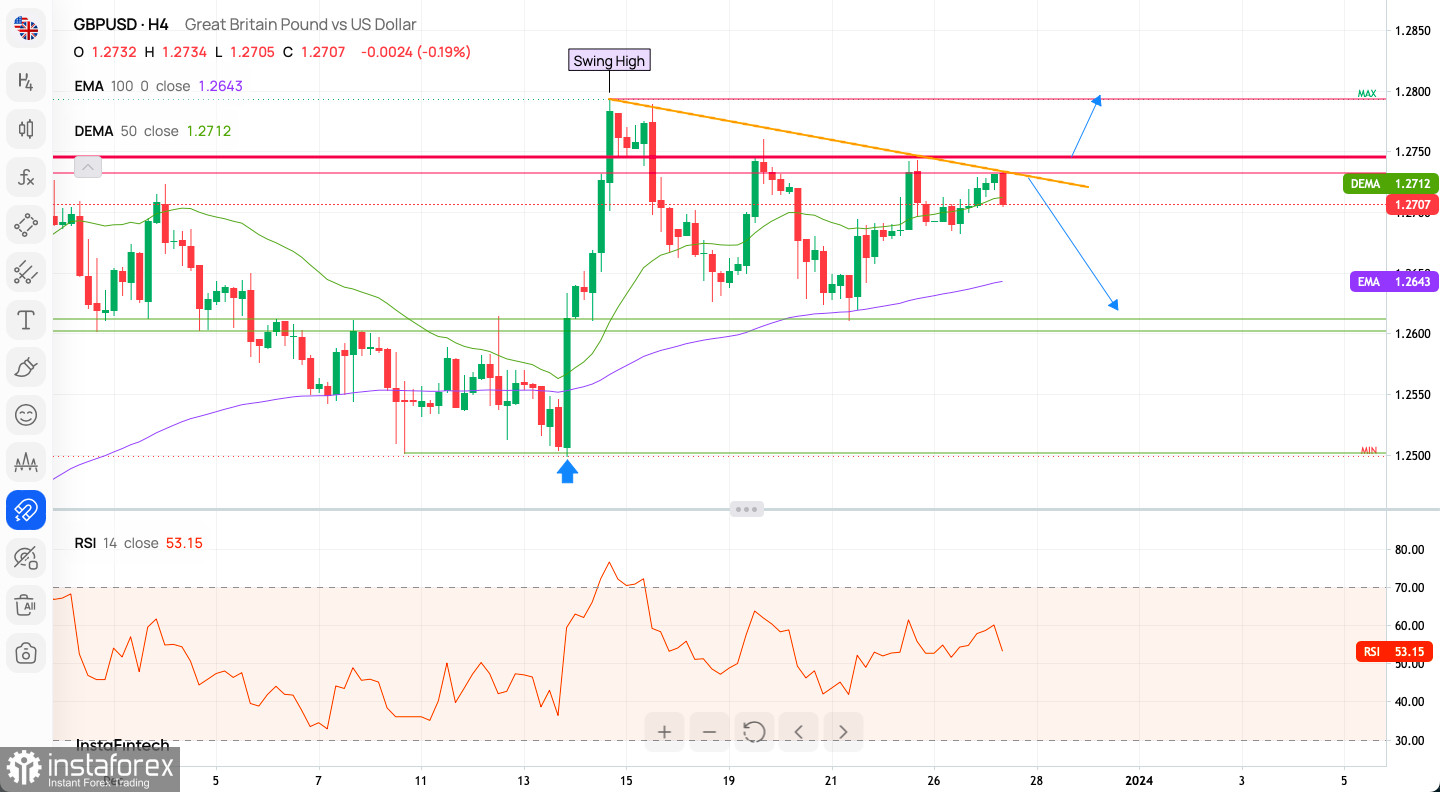
The GBP/USD pair faces resistance at 1.2734, meeting the trend line barrier repeatedly. Resistance lies at 1.2648, with support at 1.2691. Momentum is positive but waning as it nears the neutral 50 mark. A drop below 1.2614 could shift the market from bullish to bearish.

Weekly Pivot Dynamics
The pivot points for this week are as follows:
- WR3: 1.28261
- WR2: 1.27709
- WR1: 1.27522
- Weekly Pivot: 1.27157
- WS1: 1.26970
- WS2: 1.26605
- WS3: 1.26053
Bullish Signals and Cautions
The weekly chart shows a Bullish Engulfing pattern after a breakout over 1.2340. The market trends above the 50 WMA, moving toward the 100 WMA at 1.2504. A break under 1.1802 could lead to more significant declines.
Indicator Analysis
The H1 intraday indicators are mixed:
- Buy: 6 out of 21
- Neutral: 7
- Sell: 8
For moving averages:
- Buy: 17 out of 18
- Sell: 1
Sentiment Overview
The general sentiment on the scoreboard is bullish (59% vs.41% bears). Last week sentiment remains bullish as well (59%bulls vs.41% bears) while the last three days sentiment is bullish as well (64% bulls vs.36% bears).

Practical Trading Insights
- Price Action: The price has been oscillating between a swing high marked on the chart and a lower support level. It's currently nearing the upper boundary of this range, which could act as resistance.
- Trend Lines: There's a descending trend line (in red) that has been touched several times, reinforcing its significance as resistance. If the price breaks above this trend line, it could signal a change in the current trend.
- Moving Averages: The price is currently between the 100-period Exponential Moving Average (EMA, in green) and the 50-period Double Exponential Moving Average (DEMA, in orange). The EMA is below the current price, which could act as support, and the DEMA is above, which could act as resistance. The proximity of price to these averages suggests a consolidation phase.
- Relative Strength Index (RSI): The RSI is around 53.15, which is neutral. This indicates that there is neither strong buying nor selling momentum currently dominating the market. The RSI would need to move above 70 to indicate overbought conditions or below 30 to indicate oversold conditions for a stronger directional bias.
- Potential Scenarios:
- Bullish Scenario: If the price breaks above the descending trend line and the DEMA, and the RSI moves towards the overbought territory, it might indicate an upcoming bullish trend.
- Bearish Scenario: If the price fails to break the resistance and falls below the EMA, accompanied by a dip in the RSI towards the oversold region, it could suggest bearish momentum.


