Bitcoin keep trading close to the yearly highs
Understanding the 2023 Bitcoin Landscape
2023 witnessed a remarkable increase in Bitcoin's value, leading to a surge in Bitcoin millionaires. Initially priced over $16,000, Bitcoin's growth exceeded 158%, significantly impacting investor wealth. According to BitInfoCharts, the count of Bitcoin millionaires soared to 97,497, paralleling Camp Nou stadium's capacity. This growth is noteworthy compared to the beginning of the year, with Glassnode recording only 23,795 such addresses.

Bitcoin Millionaires and Price Dynamics
This rapid wealth accumulation aligns with Bitcoin's rising value. BitInfoCharts categorizes millionaires into two groups: those owning over $1 million (90,040 addresses) and over $10 million (7,457 addresses). Santiment highlights that 89% of Bitcoin's total supply is profitable. Meanwhile, NewsBTC reports that whales sold about 50,000 BTC, hinting at increased market activity and potential sell-offs.
Regulatory Developments and Price Regulations
The SEC's anticipated approval of Spot ETFs around January 10 could significantly impact Bitcoin. Experts suggest that ETFs might inject new liquidity, potentially propelling Bitcoin to new heights. However, former BitMEX CEO Arthur Hayes voices concerns about ETFs possibly affecting Bitcoin negatively. Currently, Bitcoin's value hovers around $42,400, reflecting a 3% decline over the past week.
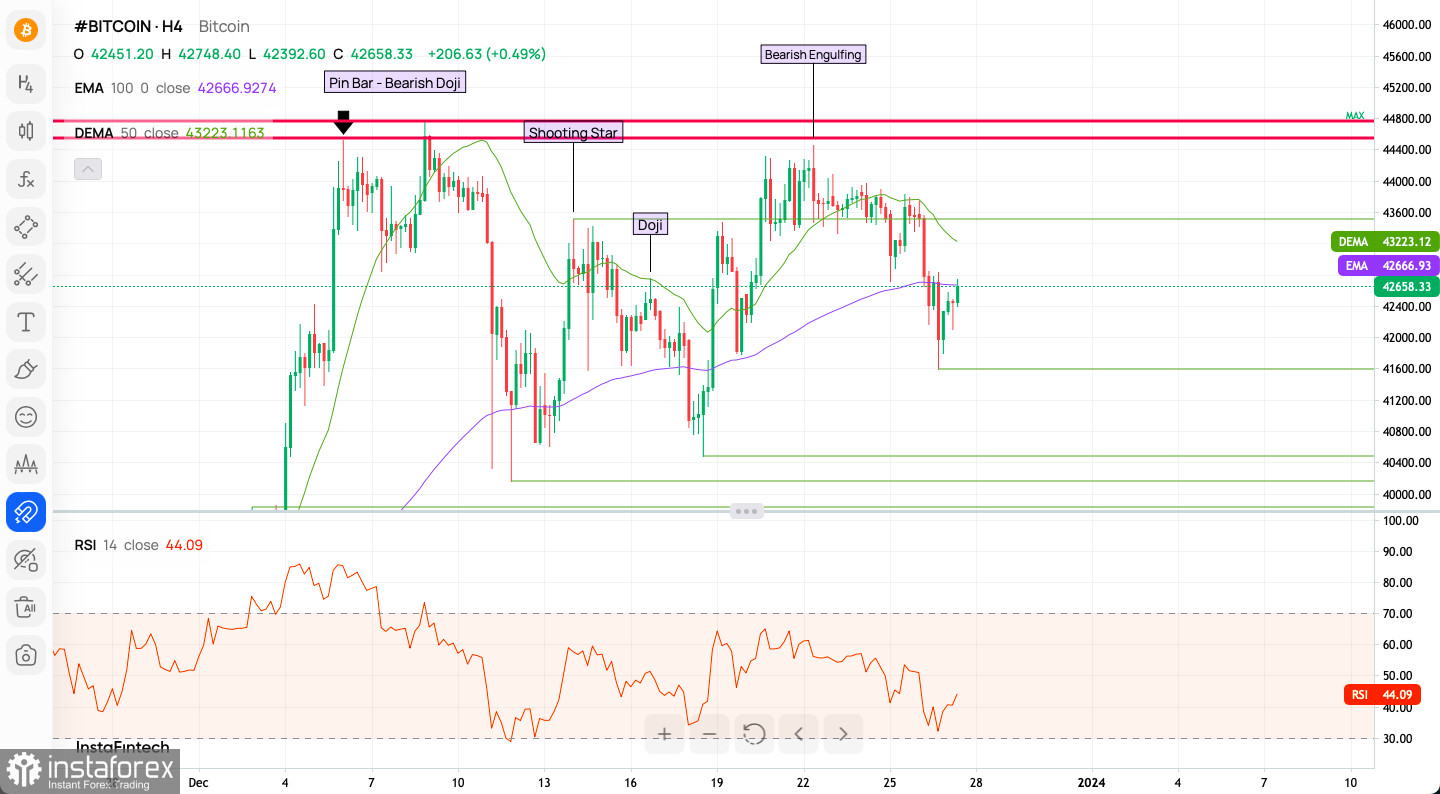
Technical Outlook: Candlestick Patterns on H4 time frame
- Bearish Engulfing and Shooting Star: Indicate potential bearish reversals.
- Doji and Bearish Doji Pin Bar: Suggest market indecision and potential bearishness.
Moving Averages and RSI
- 100 EMA (below price): Acts as a dynamic support.
- 50 DEMA (above price): Possible dynamic resistance.
- RSI at 44.09: Mild bearish momentum, not indicating an oversold condition.
Support and Resistance Levels
The current price trades below a key resistance level, with a strong support level indicated by the green line.
Market Scenarios
- Bullish Scenario: Overcoming the 50 DEMA and resistance levels, coupled with an RSI above 50, could signal a bullish reversal.
- Bearish Scenario: Failure to breach resistance and falling below the 100 EMA may continue the bearish trend.

Indicator Signals and Sentiment Scoreboard
- Intraday 1H Indicators: Predominantly indicate a sell signal.
- Sentiment Scoreboard: Remains bullish, with a majority favoring a bullish outlook.
Weekly Pivot Points
- Pivot Points: WR3 - $46,701, WR2 - $44,628, WR1 - $43,514, Weekly Pivot - $42,554, WS1 - $41,441, WS2 - $40,481, WS3 - $38,408.
Long-Term Trading Outlook
A potential uptrend is suggested by the recent breakout above resistance, targeting $48,200 for bulls. Key support levels are identified at $32,829 and $31,790.
Conclusion: Trading Insights for Bulls and Bears
For bullish traders, surpassing key resistance levels and maintaining momentum above the 50 DEMA could pave the way for growth. Conversely, bears may focus on the failure to breach resistance and a potential drop below the 100 EMA as indicators for further declines.
Useful Links
Important Reminder
The begginers in forex trading need to be very careful when making decisions about entering the market. Before the release of important reports, it is best to stay out of the market to avoid being caught in sharp market fluctuations due to increased volatility. If you decide to trade during the news release, then always place stop orders to minimize losses.
Without placing stop orders, you can very quickly lose your entire deposit, especially if you do not use money management and trade large volumes. For successful trading, you need to have a clear trading plan and stay focues and disciplined. Spontaneous trading decision based on the current market situation is an inherently losing strategy for a scalper or daytrader.


