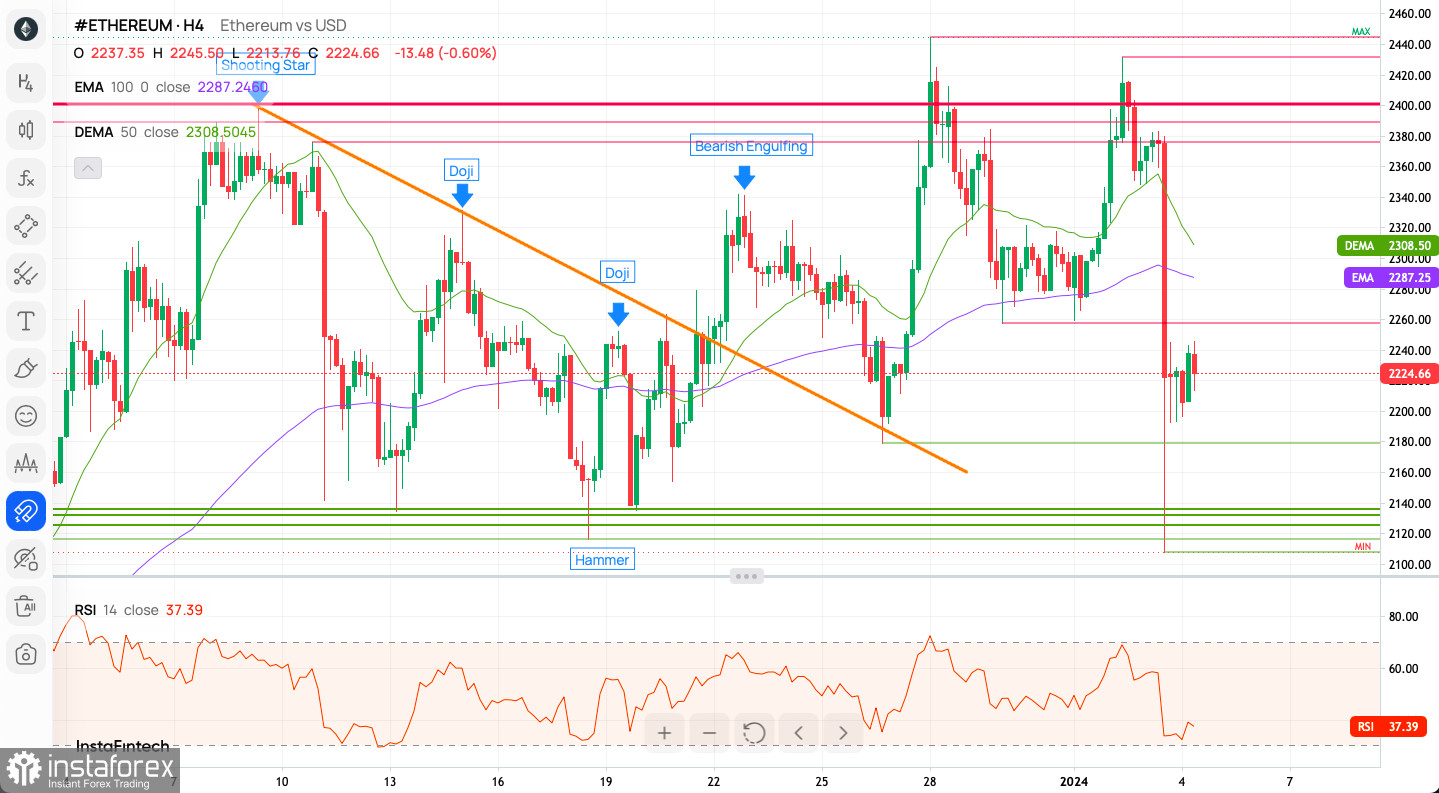
Ethereum's Volatile Path in Early 2024
Key Takeaways:
- Ethereum's sharp reversal after reaching 2023 highs.
- Rumors of ETF postponements trigger market sell-offs.
- Despite short-term volatility, long-term sentiment remains bullish.
The Tides of Crypto Market Sentiment
The crypto markets, including Ethereum, have recently experienced significant fluctuations. This volatility is largely tied to the anticipation and subsequent disappointment surrounding the approval of crypto spot exchange-traded funds (ETFs) by the SEC. Reports suggesting a delay in these approvals led to a notable downturn in Ethereum's price.

Ethereum's Technical Reversal
Ethereum's value soared, reaching 2023 highs, driven by expectations of an ETH spot ETF filed by BlackRock. However, the ETH/USD pair sharply reversed following rumors about the postponement of Bitcoin ETF approvals to Q2 2024, as per a Matrixport report. This news caused a -13.17% sell-off, dropping the price to $2,140 before a modest recovery.
Analyzing the Technical Indicators
The current technical indicators reflect a predominantly bearish sentiment in the short term:
- 14 out of 23 indicators signal a Sell.
- 6 indicators suggest a Buy, while 2 remain Neutral.
- All 18 moving averages lean towards a Sell.
Market Sentiment Overview
Despite the immediate downturn, the general sentiment is surprisingly bullish, with 77% favoring bulls versus 23% bears. This optimistic outlook persists even when considering the past week and the last three days.

Weekly Pivot Points and Trading Outlook
Pivot points, crucial for identifying trend reversals and support/resistance levels, present the following key figures:
- WR3: $2,562
- WR2: $2,471
- WR1: $2,440
- Weekly Pivot: $2,380
- WS1: $2,340
- WS2: $2,289
- WS3: $2,199
The Ethereum market has shown an upward trend since reaching a low at $1,520. The key long-term support at $1,368 is crucial, and as long as prices stay above this level, the bullish outlook remains intact. The mid-term technical support at $1,913 is pivotal; a sustained break below this could shift the long-term perspective to bearish.
Conclusion: Bull and Bear Scenarios
For bulls, holding above $1,368 signals strength and potential for upward movement. However, bears might gain control if prices fall consistently below $1,913. This period reflects a critical juncture for Ethereum, emphasizing the importance of monitoring market sentiments and pivot points for trading insights.


