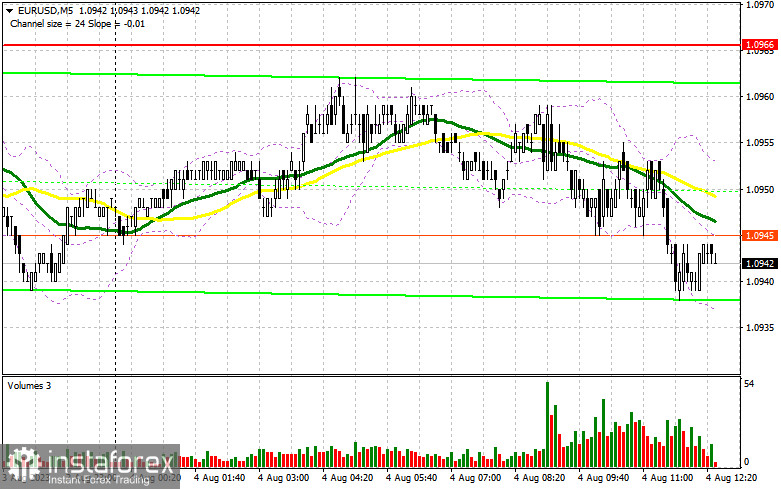
In my earlier forecast, I highlighted the significance of the 1.0966 level and suggested using it as a basis for trading decisions. Let's examine the 5-minute chart and assess the recent developments. Due to low volatility, there were no substantial changes in the market, and we did not reach the previously mentioned levels. The technical outlook remains unchanged for the second half of the day.

To initiate long positions on EUR/USD, the following conditions should be met:
During the second half of the day, all attention will be on the US non-farm payroll data. If the indicator surpasses economists' forecasts for July, it could lead to a sharp decline in the currency pair, retesting monthly lows. However, if the data shows a cooling labor market, the euro might have a chance for a more substantial recovery by the end of the week.
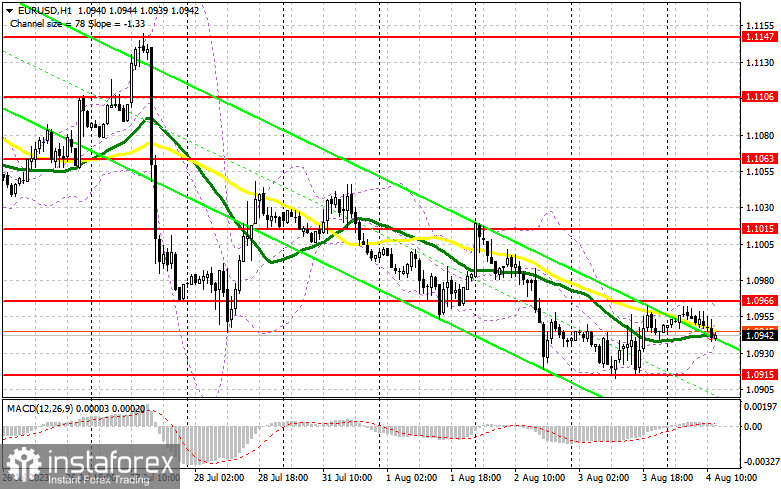
In my view, the most interesting opportunity for buying would arise after a significant drop in EUR/USD towards the support area at 1.0915. Only after a false breakthrough is formed at this level, a buying signal aiming for an upward movement to test the resistance at 1.0966 can be considered. A successful breakthrough and subsequent retest of this range, along with weak US statistics, may strengthen the demand for the euro, potentially pushing it back to the peak at 1.1015. My ultimate target remains the area around 1.1063, where I will take profit. However, if we witness a decline in EUR/USD and a lack of activity at 1.0915 in the second half of the day (considering this level has already been tested multiple times for strength), euro buyers might face challenges, and the bearish trend could further develop. In such a scenario, only a false breakthrough around the next support at 1.0871 would provide a signal for buying the euro. I will initiate long positions after a rebound from the minimum of 1.0836, targeting a 30-35 point upward correction within the day.
To initiate short positions on EUR/USD, the following conditions should be met:
Sellers still have opportunities to sustain the bearish market today, especially if trading remains below the crucial 1.0966 level. If EUR/USD rises after a weak US labor market report, I plan to open short positions only after a false breakthrough is formed around 1.0966. This would likely lead to a decline toward 1.0915. Only after a successful breakthrough and consolidation below this range, followed by a bottom-up retest, would I consider a selling signal, targeting a direct path to 1.0871, indicating the establishment of a bearish trend. My ultimate target for short positions would be the area around 1.0836, where I will take profit. However, if EUR/USD moves upward during the American session, and there is a lack of bearish pressure at 1.0966 (which is plausible), bulls might try to prove their presence, leading to an upward correction at the end of the week. In such a scenario, I will postpone short positions until the next resistance at 1.1015. There, selling can also be considered, but only after a failed consolidation. I will initiate short positions after a rebound from the maximum of 1.1063, targeting a 30-35 point downward correction.


Indicator signals:
Moving averages
Trading is taking place around the 30-day and 50-day moving averages, indicating a sideways market.
Note: The author considers the period and prices of the moving averages on the hourly chart (H1) and it differs from the general definition of classical daily moving averages on the daily chart (D1).
Bollinger Bands
In the case of an uptrend, the upper boundary of the indicator around 1.0966 will act as resistance.
Description of Indicators:
• Moving Average (determines the current trend by smoothing volatility and noise). Period 50. Marked in yellow on the chart.
• Moving Average (determines the current trend by smoothing volatility and noise). Period 30. Marked in green on the chart.
• MACD Indicator (Moving Average Convergence/Divergence - convergence/divergence of moving averages). Fast EMA period 12. Slow EMA period 26. SMA period 9.
• Bollinger Bands. Period 20.
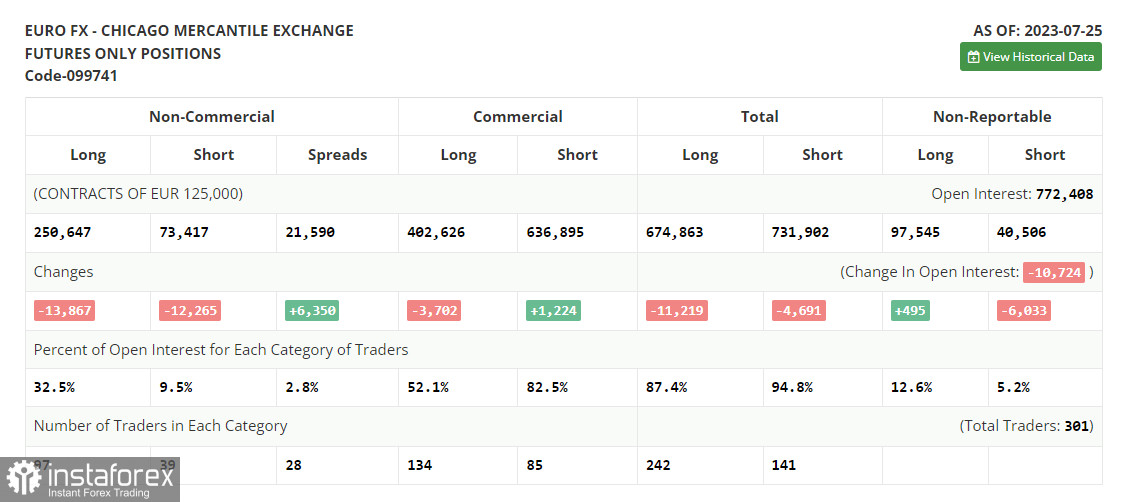
• Non-commercial traders - speculators, such as individual traders, hedge funds, and large institutions using the futures market for speculative purposes and meeting specific requirements.
• Long non-commercial positions represent the total long open positions of non-commercial traders.
• Short non-commercial positions represent the total short open positions of non-commercial traders.
• The total non-commercial net position is the difference between the short and long positions of non-commercial traders.


